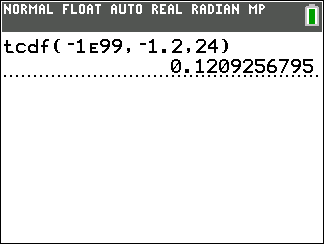
Calculator
Adding Info to Lists
-
To access lists, press STATSTAT, select EditEdit from the top menu, choose Edit...Edit horizontal ellipsis, and press ENTEREnter key.
-
To input data by column, type a numerical value and press ENTEREnter key after each entry. Press the right arrow key to navigate to a new list.
-
To clear a list, navigate to the name of the list, such as L2L2, then press CLEARClear, then ENTEREnter key.
ANOVA
One-Way
-
press STATSTAT, select EditEdit from the top menu, choose Edit...Edit horizontal ellipsis, and press ENTEREnter key.
-
Input the data into the lists. See Adding Info to Lists for further help on entering your data.
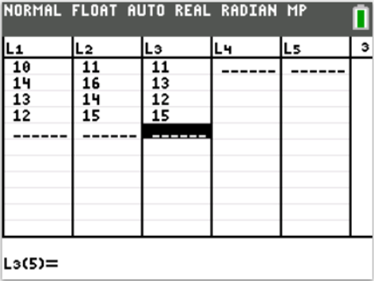
-
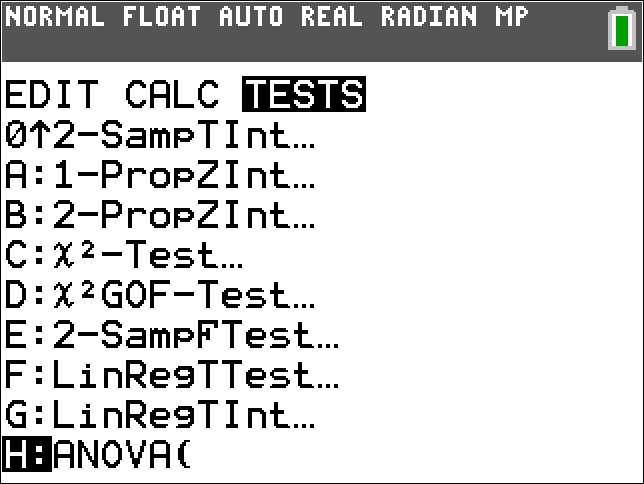
Press STATSTAT and select TESTSTESTS from the top menu, then scroll down to option ANOVA(ANOVA left parenthesis. Press ENTEREnter key.
-
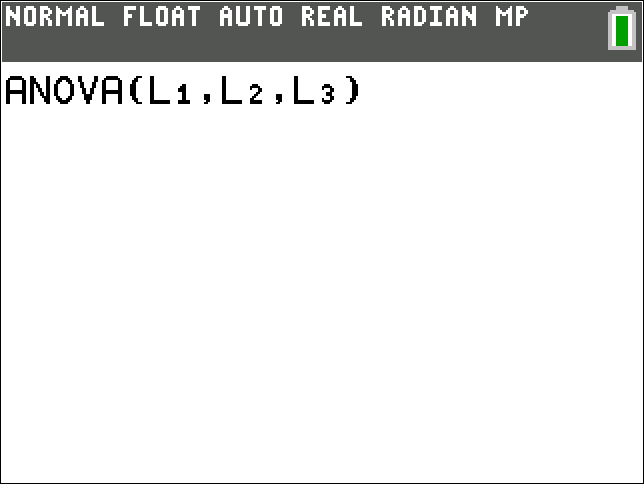
Enter ANOVA(L1,L2,L3)ANOVA left parenthesis L1, L2,L3 right parenthesis. Note that lists can be entered by pressing 2ndsecond followed by the number of the list. For example, 2ndsecond and 1one gives L1L1.
-
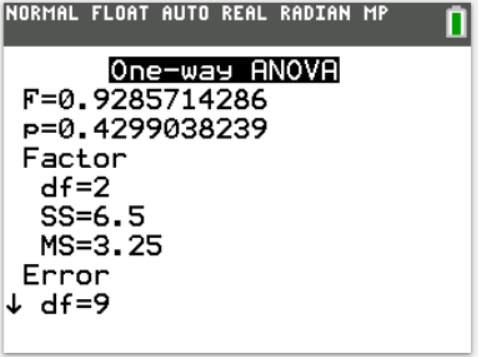
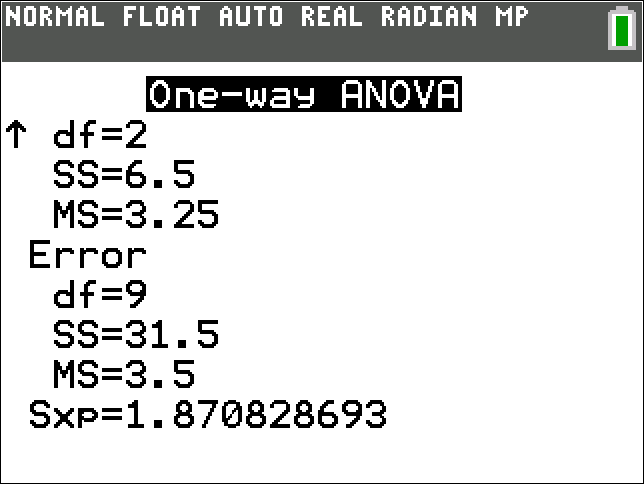
Press ENTEREnter key to display the results.
Binomial Distribution
Binomial Probability (pdf)
-
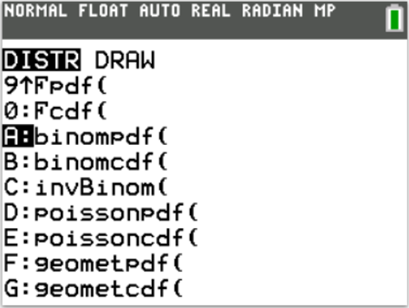
Select DISTRDISTR by pressing 2ndTwo less than sup greater than nd less than divided by sup greater than and then VARSvars.
-
Scroll down to option binompdf(binompdf left parenthesis. Press ENTEREnter key.
-
-
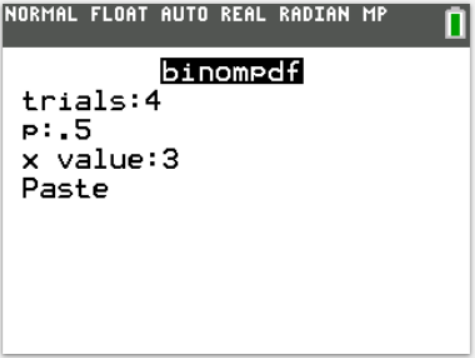
If prompted, input the number of trials, the probability of success, and the number of successes. Highlight PASTEPASTE and then press ENTEREnter key.
-
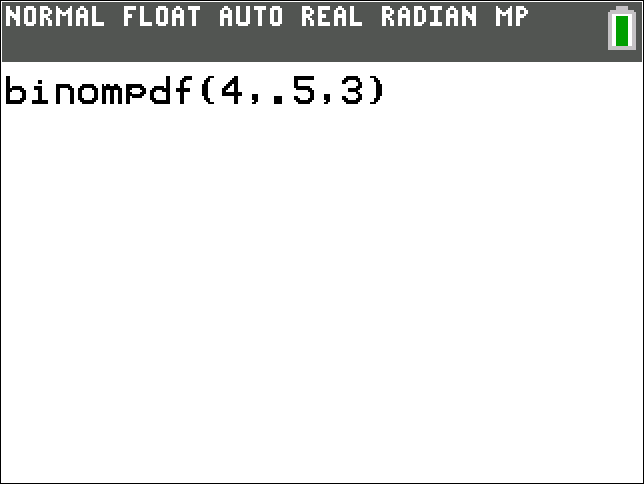
If not prompted, type the number of trials, the probability of success, and the number of successes separated by commas.
-
-
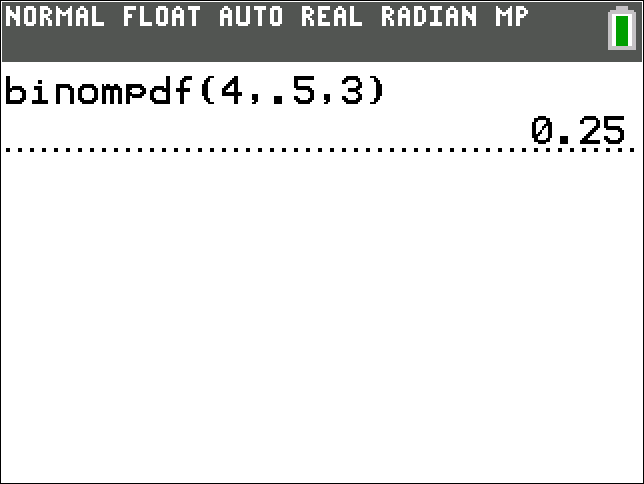
Press ENTEREnter key to display the probability.
Binomial Probability Distribution
-
Select DISTRDISTR by pressing 2ndTwo less than sup greater than nd less than divided by sup greater than and then VARSvars.
-
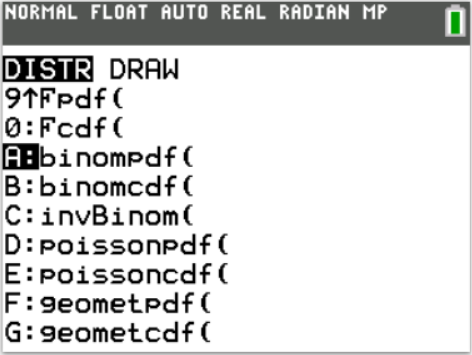
Scroll down to option binompdf(binompdf left parenthesis. Press ENTEREnter key.
-
-
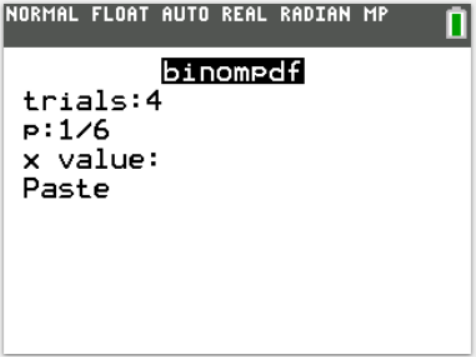
If prompted, input the number of trials and the probability of success. Highlight PASTEPASTE and then press ENTEREnter key.
-
If not prompted, type the number of trials and the probability of success separated by a comma. Press )right parenthesis.
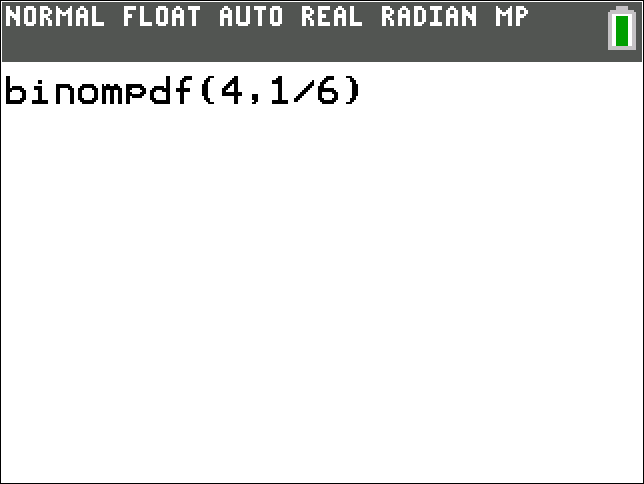
-
-
To store the probabilities in L2L2, press STO→STO→ semicolon, then 2ndsecond, and then 2Two. Press ENTEREnter key.
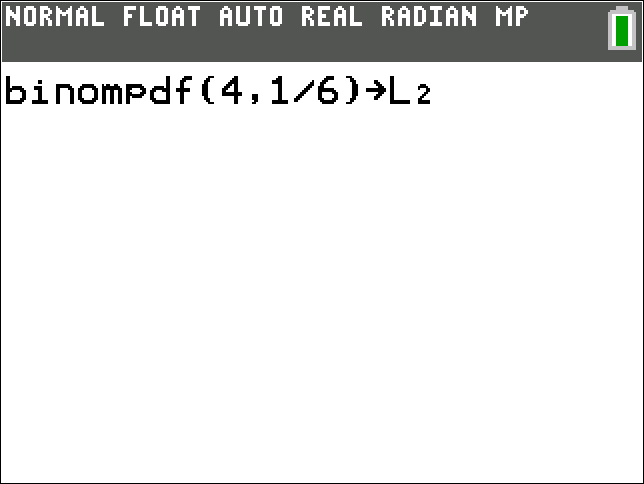
-
press STATSTAT, select EditEdit from the top menu, choose Edit...Edit horizontal ellipsis, and press ENTEREnter key. See Adding Info to Lists for further help on entering your data.
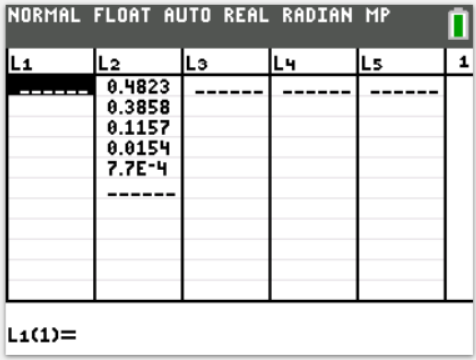
-
Input the values 0 to n in L1L1 to complete the binomial distribution table.
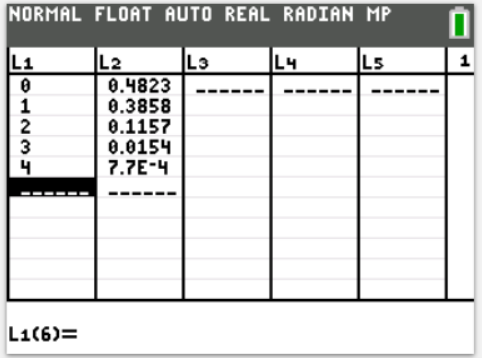
Binomial Probability (cdf)
-
Select DISTRDISTR by pressing 2nd2 less than sup greater than nd less than divided by sup greater than and then VARSvars.
-
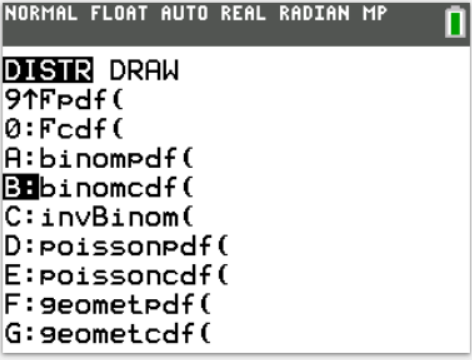
Scroll down to option binomcdf (binomcdf left parenthesis. Press ENTEREnter key.
-
-
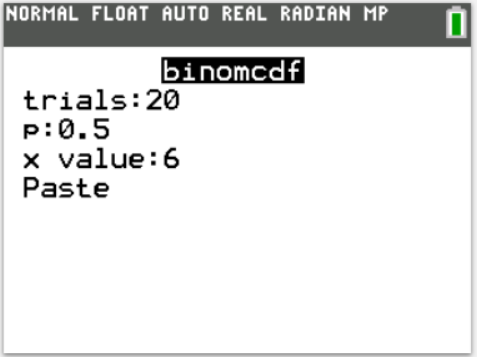
If prompted, input the number of trials, the probability of success, and the number of successes. Highlight PASTEPASTE and then press ENTEREnter key.
-
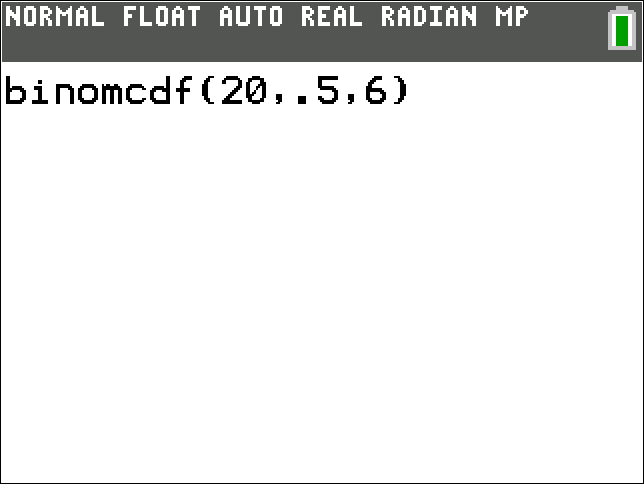
If not prompted, type the number of trials, the probability of success, and the number of successes separated by commas.
-
-
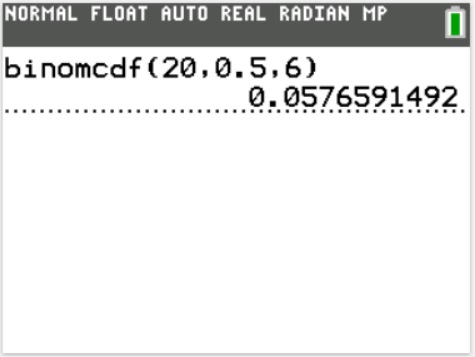
Press ENTEREnter key to display the cumulative probability.
Chi-Square Distribution
Left Tailed Probability (cdf)
Used for finding the p-value corresponding to a χ2 test statistic.
-
Select DISTRDISTR by pressing 2ndTwo less than sup greater than nd less than divided by sup greater than and then VARSvars.
-
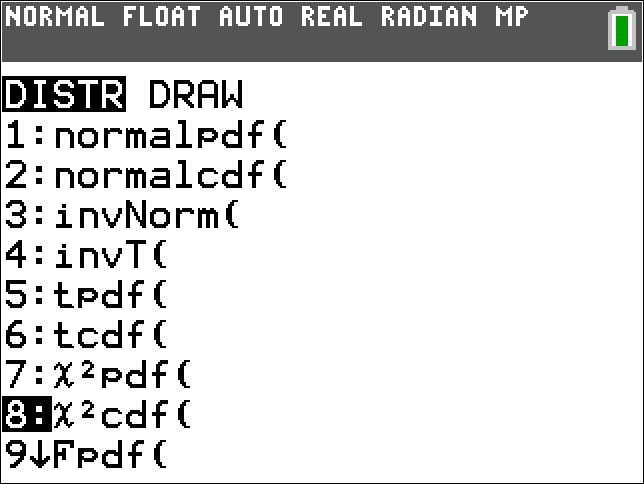
Scroll down to χ2cdf(χ semicolon less than sup greater than Two less than divided by sup greater than cdf left parenthesis from the menu. Press ENTEREnter key.
-
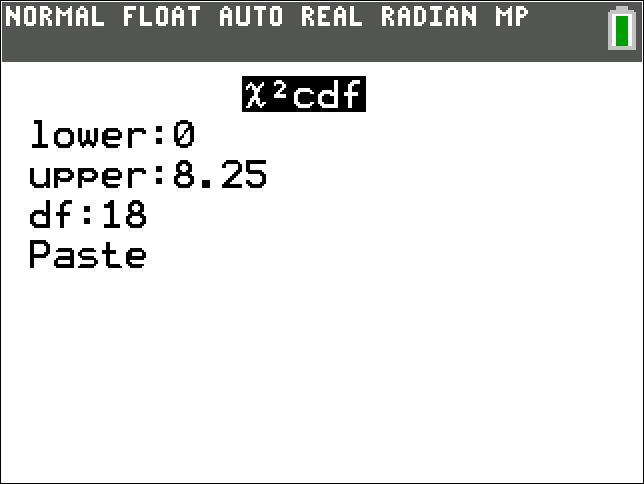
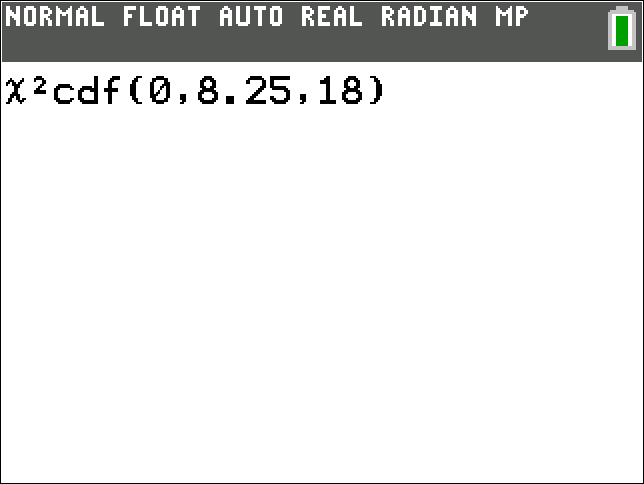
Input 0zero (the lower bound), the χ2 test statistic, and the degrees of freedom separated by commas.
-
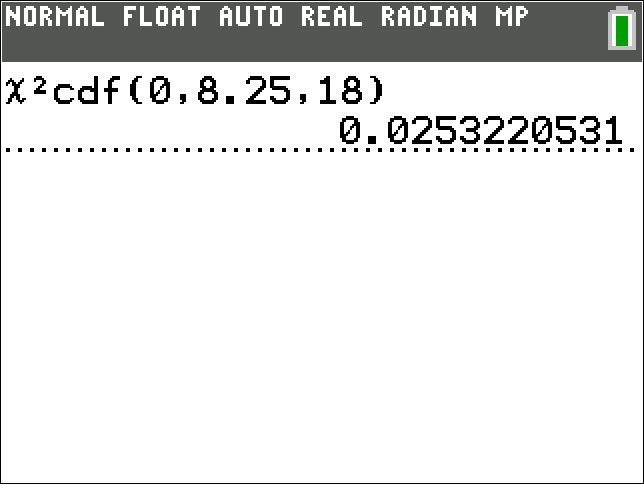
Press ENTEREnter key.
Right Tailed Probability (cdf)
Used for finding the p-value corresponding to a χ2 test statistic.
-
Select DISTRDISTR by pressing 2nd2 less than sup greater than nd less than divided by sup greater than and then VARSvars.
-
Scroll down to χ2cdf(χ semicolon less than sup greater than 2 less than divided by sup greater than cdf left parenthesis from the menu. Press ENTEREnter key.
-
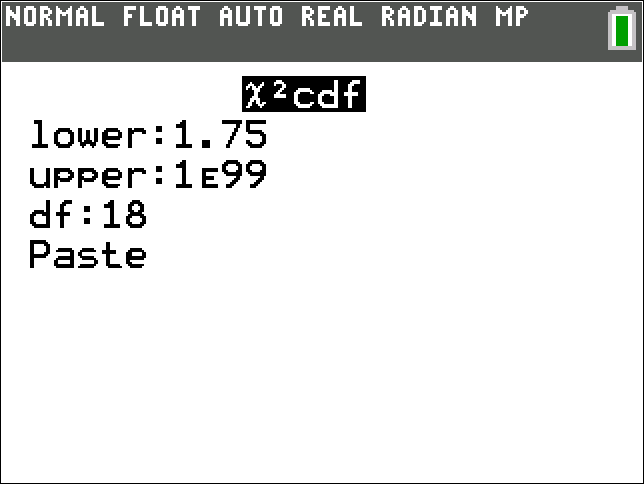
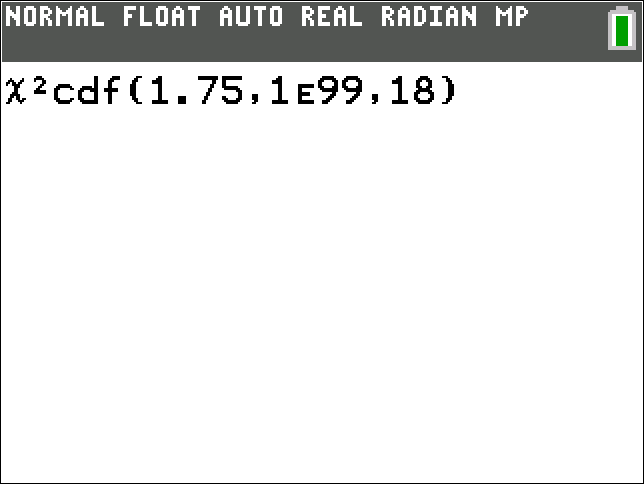
Input the χ2 test statistic, the upper bound, and the degrees of freedom separated by commas.
Note, if your upper bound is positive infinity, use a very large positive number such as 1E991E99. The symbol EE is entered by pressing 2ndsecond and then ,,.
-
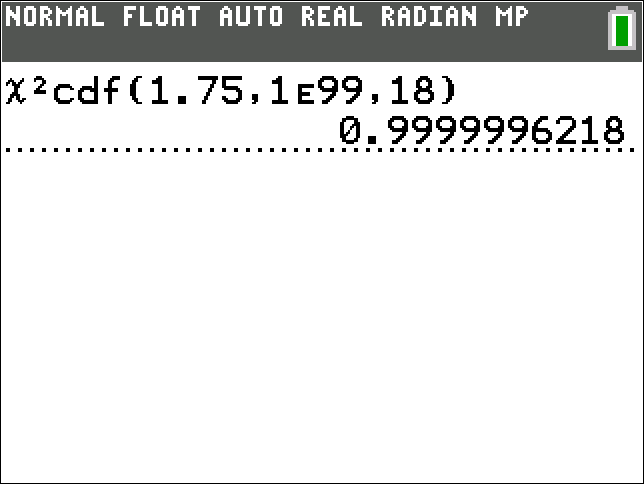
Press ENTEREnter key.
Test for Association
-
Select MATRIXMATRIX by either pressing MATRXMATRX or by pressing 2nd2 less than sup greater than nd less than divided by sup greater than and thenx-1x less than sup greater than negative 1 less than divided by sup greater than, depending on your calculator version.
-
select EditEdit from the top menu, and [A]left square bracket A right square bracket. Press ENTEREnter key.
-
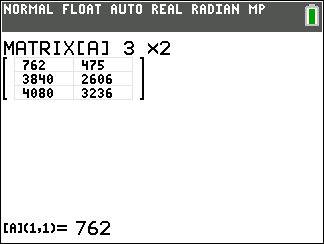
Enter the matrix dimensions: number of rows by number of columns. Input the actual data into the matrix with the observed data in the first column [A]left square bracket A right square bracket of the matrix and the expected values in the second column [B]left square bracket B right square bracket.
-
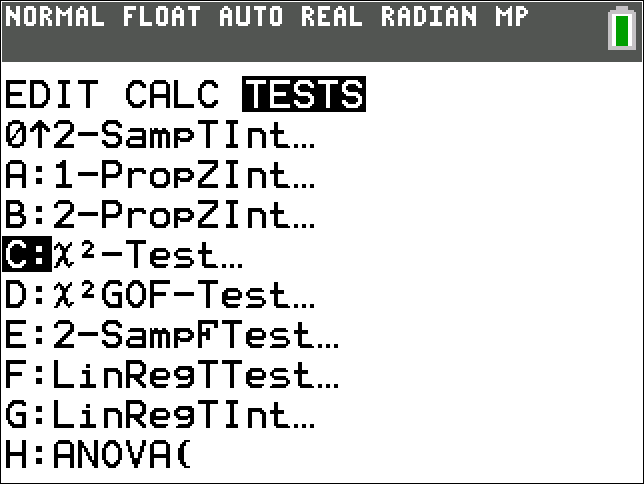
Press STATSTAT, select TESTSTESTS from the top menu, and scroll down to χ2-Test. Press ENTEREnter key.
-
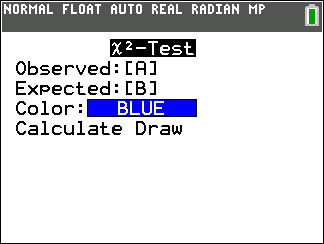
Enter [A]left square bracket A right square bracket for Observed, and [B]left square bracket B right square bracket for Expected. Note that matrices can be entered by pressing MATRXMATRX and selecting the appropriate matrix's name from the list.
-
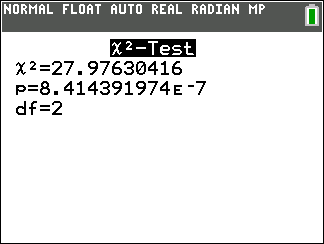
Select CalculateCalculate and press ENTEREnter key.
Test for Goodness of Fit
-
press STATSTAT, select EditEdit from the top menu, choose Edit...Edit horizontal ellipsis, and press ENTEREnter key.
-
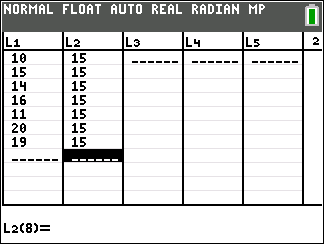
Input the observed data in L1L1 and the expected values in L2L2. See Adding Info to Lists for further help on entering your data.
-
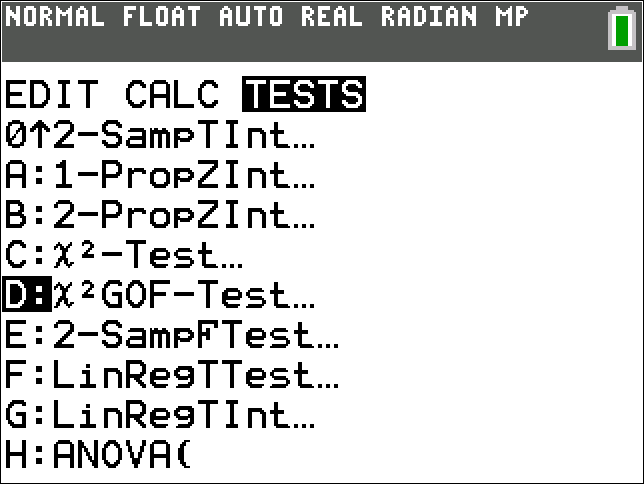
Press STATSTAT, select TESTSTESTS from the top menu, and scroll down to χ2GOF-Testχ semicolon less than sup greater than 2 less than divided by sup greater than GOF minus Test. Press ENTEREnter key.
-
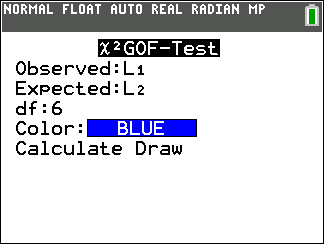
Enter L1L1 for Observed, and L2L2 for Expected. Note that lists can be entered by pressing 2ndsecond followed by the number of the list. For example, 2ndsecond and 1one gives L1L1.
Enter the appropriate degrees of freedom (df).
-
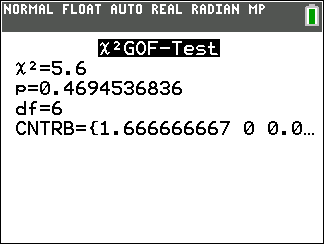
Select CalculateCalculate and press ENTEREnter key.
Confidence Intervals
Proportion
-
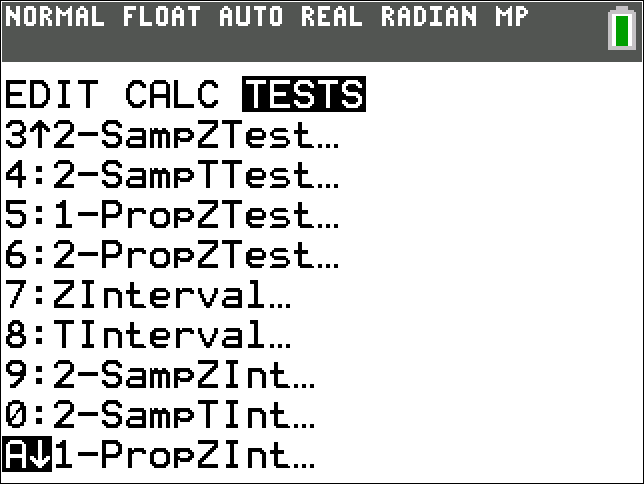
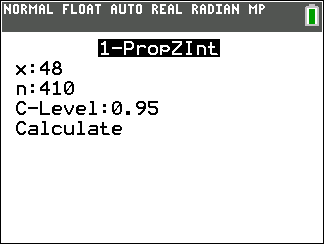
Press STATSTAT and select TESTSTESTS from the top menu, then scroll down to option 1-PropZIntOne minus Propz Int. Press ENTEREnter key.
-
Input the number of successes, the number of observations, and the confidence level.
-
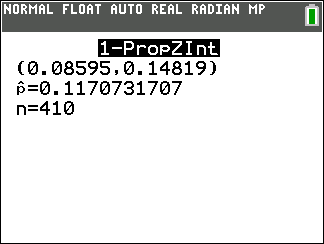
Select CalculateCalculate and press ENTEREnter key.
t-Interval
Using Summary Statistics
-
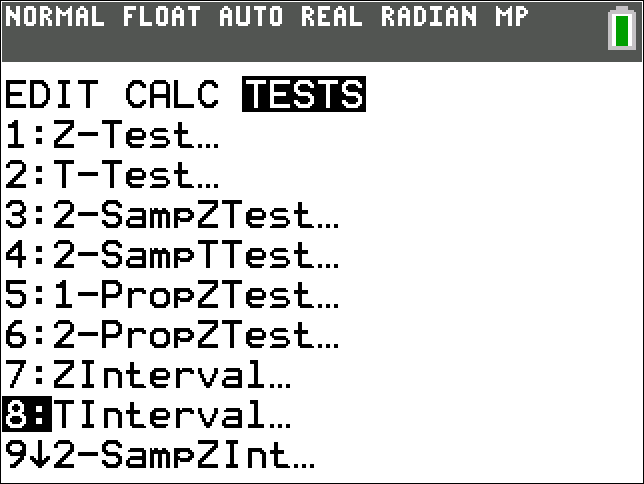
Press STATSTAT and select TESTSTESTS from the top menu, then scroll down to option TIntervalT Interval. Press ENTEREnter key.
-
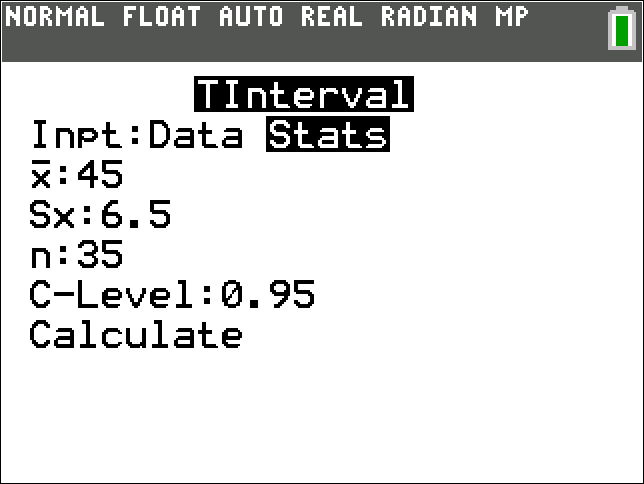
Choose StatsStats and press ENTEREnter key.
-
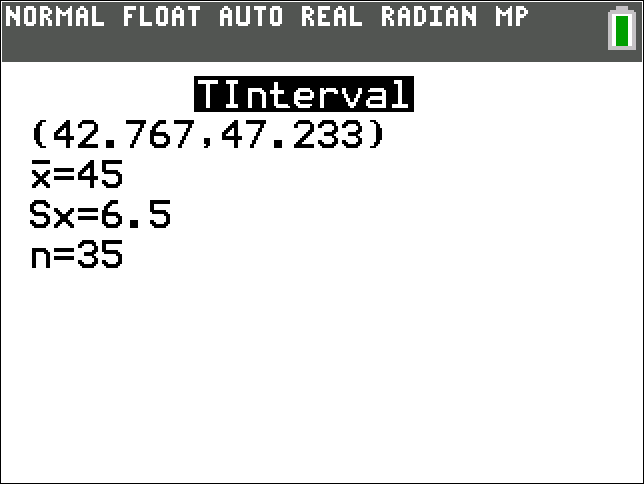
Input the sample mean, the sample standard deviation, the sample size, and the confidence level.
-
Select CalculateCalculate and press ENTEREnter key.
Using Data
-
press STATSTAT, select EditEdit from the top menu, choose Edit...Edit horizontal ellipsis, and press ENTEREnter key.
-
Input the data in the column labeled L1L1, pressing ENTEREnter key after each value. See Adding Info to Lists for further help on entering your data.
-
Press STATSTAT and select TESTSTESTS from the top menu, then scroll down to option TIntervalT Interval. Press ENTEREnter key.
-
Choose DataData as the input and press ENTEREnter key.
-
Input the confidence level.
Note that lists can be entered by pressing 2ndsecond followed by the number of the list. For example, 2ndsecond and 1one gives L1L1. Also, the frequency of the list should be 1.
-
Select CalculateCalculate and press ENTEREnter key.
z-Interval
Using Summary Statistics
-
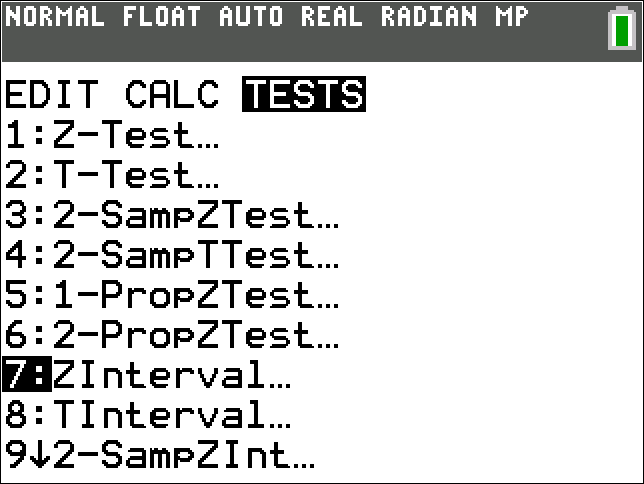
Press STATSTAT and select TESTSTESTS from the top menu, then scroll down to option ZIntervalZ Interval. Press ENTEREnter key.
-
Choose StatsStats and press ENTEREnter key.
-
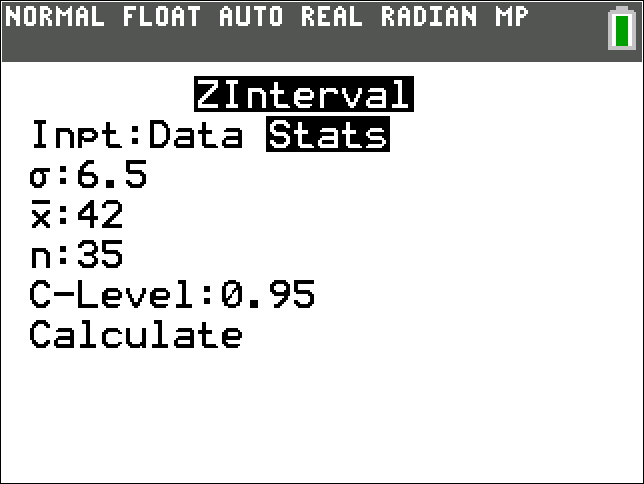
Input the population standard deviation, the sample mean, the sample size, and the confidence level.
-
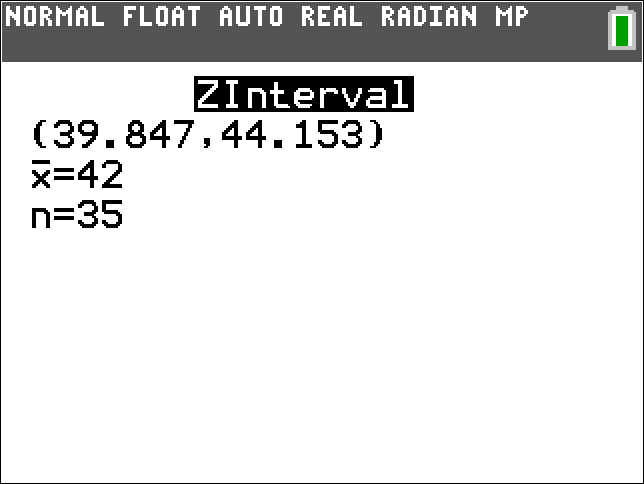
Select CalculateCalculate and press ENTEREnter key.
Using Data
-
press STATSTAT, select EditEdit from the top menu, choose Edit...Edit horizontal ellipsis, and press ENTEREnter key.
-
Input the data in the column labeled L1L1, pressing ENTEREnter key after each value. See Adding Info to Lists for further help on entering your data.
-
Press STATSTAT and select TESTSTESTS from the top menu, then scroll down to option ZIntervalZ Interval. Press ENTEREnter key.
-
Choose DataData as the input and press ENTEREnter key.
-
Input the population standard deviation and the confidence level.
Note that lists can be entered by pressing 2ndsecond followed by the number of the list. For example, 2ndsecond and 1one gives L1L1. Also, the frequency of the list should be 1.
-
Select CalculateCalculate and press ENTEREnter key.
Two Sample z-Interval
Using Summary Statistics
-
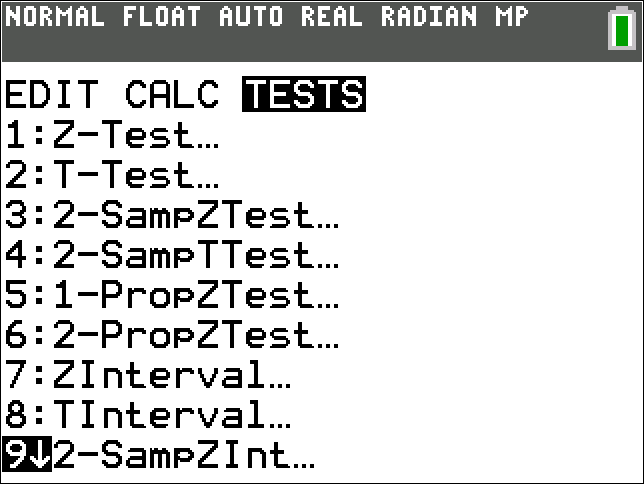
Press STATSTAT and select TESTSTESTS from the top menu, then scroll down to option 2-SampZInt2 minus Sampz Int. Press ENTEREnter key.
-
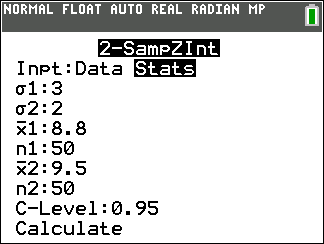
Choose StatsStats and press ENTEREnter key.
-
Input both population standard deviations, both sample means, both sample sizes, and the confidence level.
-
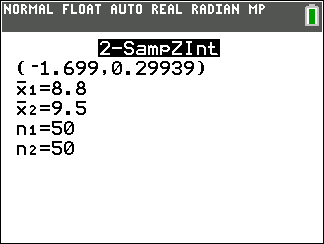
Select CalculateCalculate and press ENTEREnter key.
Using Data
-
press STATSTAT, select EditEdit from the top menu, choose Edit...Edit horizontal ellipsis, and press ENTEREnter key.
-
Input the data for Sample 1 in the column labeled L1L1, pressing ENTEREnter key after each value. Input the data for Sample 2 in the column labeled L2L2, pressing ENTEREnter key after each value. See Adding Info to Lists for further help on entering your data.
-
Press STATSTAT and select TESTSTESTS from the top menu, then scroll down to option 2-SampZInt2 minus Sampz Int. Press ENTEREnter key.
-
Choose DataData as the input and press ENTEREnter key.
-
Input both population standard deviations and the confidence level.
Note that lists can be entered by pressing 2ndsecond followed by the number of the list. For example, 2ndsecond and 1one gives L1L1. Also, the frequency for each list should be 1.
-
Select CalculateCalculate and press ENTEREnter key.
Two Sample t-Interval (Dependent Samples, Paired Difference)
Using Summary Statistics
Using Data
-
press STATSTAT, select EditEdit from the top menu, choose Edit...Edit horizontal ellipsis, and press ENTEREnter key.
-
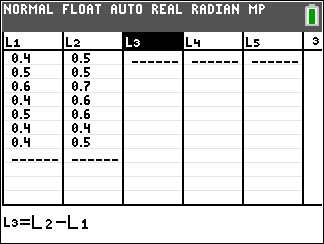
Input the data for Sample 1 (before data) in the column labeled L1L1, pressing ENTEREnter key after each value. Input the data for Sample 2 (after data) in the column labeled L2L2, pressing ENTEREnter key after each value. See Adding Info to Lists for further help on entering your data.
-
Highlight L3L3 and enter the formula L2L2 − L1L1 and then ENTEREnter key.
Note that lists can be entered by pressing 2ndsecond followed by the number of the list. For example, 2ndsecond and 1one gives L1L1.
-
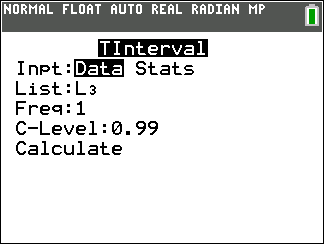
Press STATSTAT and select TESTSTESTS from the top menu, then scroll down to option TIntervalT Interval. Press ENTEREnter key.
-
Choose DataData as the input and press ENTEREnter key.
-
Input L3L3 for the ListList and input the confidence level. Note, the frequency of the list should be 1.
-
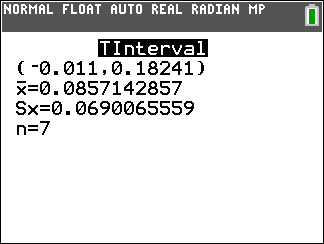
Select CalculateCalculate and press ENTEREnter key.
Two Sample t-Interval (Independent Samples)
Using Summary Statistics
-
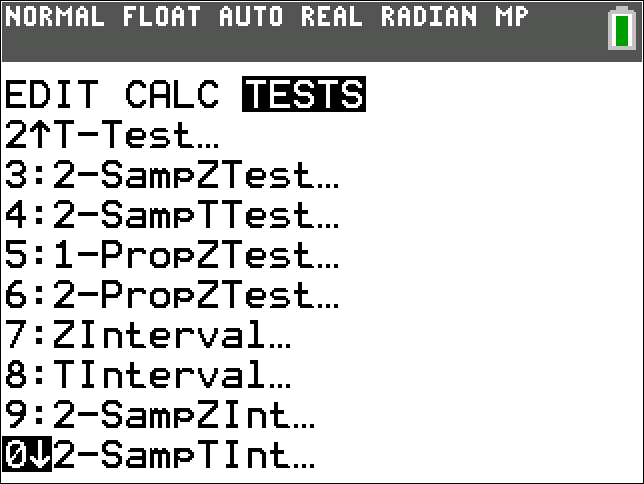
Press STATSTAT, select TESTSTESTS from the top menu, and scroll down to 2-SampTInt2 minus SampTInt. Press ENTEREnter key.
-
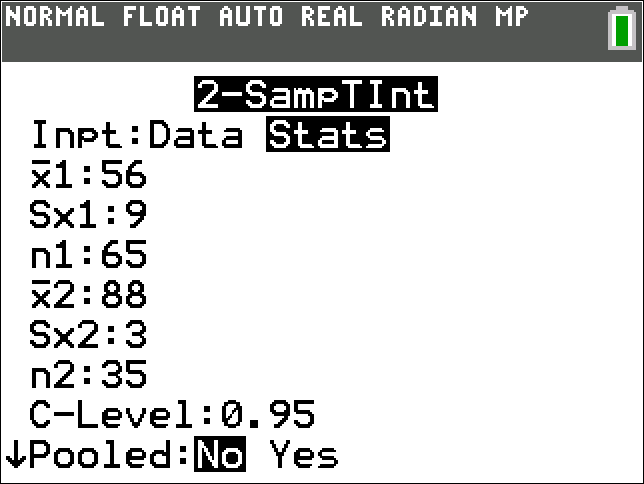
Choose StatsStats as the input and press ENTEREnter key.
-
Input the sample mean, the sample standard deviation, and the sample size for sample 1 and 2. Input the confidence level.
For Pooled:Pooled colon choose “Yes” when assuming the population variances are equal and choose “No” when assuming the population variances are not equal.
-
Select CalculateCalculate and then press ENTEREnter key to observe the results of the test.
Note: Many calculators use an alternate formula for the number of degrees of freedom so solutions may vary.
Using Data
-
press STATSTAT, select EditEdit from the top menu, choose Edit...Edit horizontal ellipsis, and press ENTEREnter key.
-
-
Input the data for Sample 1 under L1L1, pressing ENTEREnter key after each value. See Adding Info to Lists for further help on entering your data.
-
Input the data for Sample 2 under L2L2, pressing ENTEREnter key after each value.
-
-
Press STATSTAT, select TESTSTESTS from the top menu, and scroll down to 2-SampTInt2 minus SampTInt. Press ENTEREnter key.
-
Choose DataData as the input and press ENTEREnter key.
-
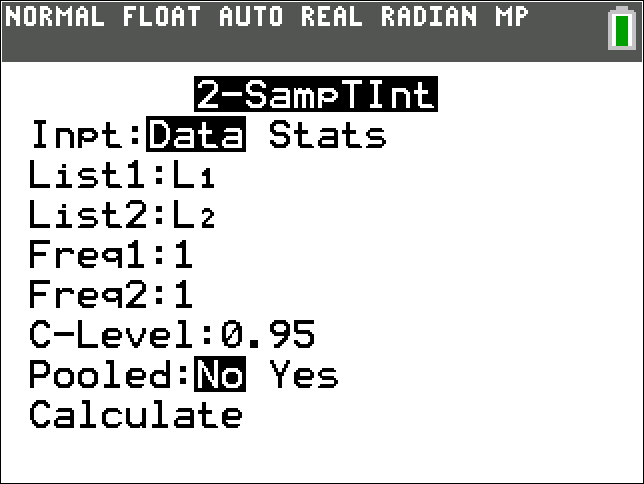
Input the list names where the data is stored. Note that lists can be entered by pressing 2ndsecond followed by the number of the list. For example, 2ndsecond and 1one gives L1L1.
Input the confidence level.
For Pooled:Pooled colon choose “Yes” when assuming population variances are equal and choose “No” when assuming the population variances are not equal.
-
Select CalculateCalculate and then press ENTEREnter key to observe the results of the test.
Note: Many calculators use an alternate formula for the number of degrees of freedom so solutions may vary.
Two Sample Proportions z-Interval
-
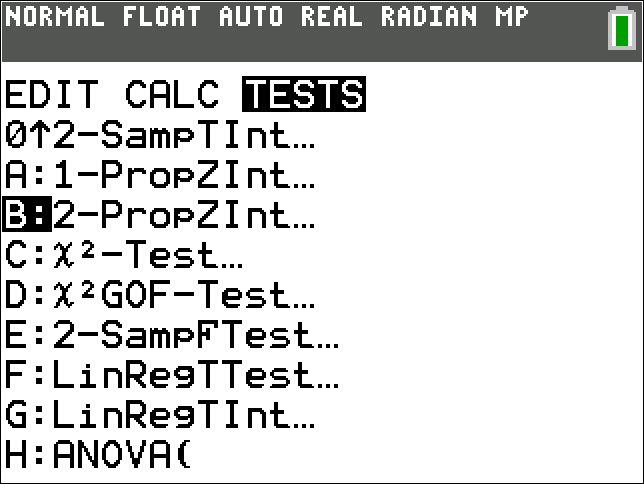
Press STATSTAT and select TESTSTESTS from the top menu, then scroll down to option 2-PropZInt2 minus Propz Int. Press ENTEREnter key.
-
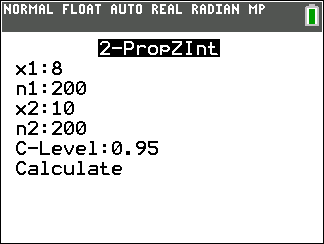
Input the number of successes for both samples, the number of observations for both samples, and the confidence level.
-
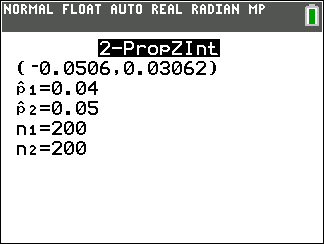
Select CalculateCalculate and press ENTEREnter key.
Counting
Combination
-
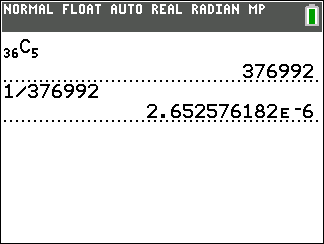
Enter the number of objects.
-
Press MATHMathMath and select PROBPROB from the top menu, then choose option nCrnCr. Press ENTEREnter key.
-
Enter the number of objects taken at a time. Press ENTEREnter key.
-
Divide 1 by the resulting number of combinations to find the probability of any single combination occurring.
Note, the resulting number of combinations can be entered by using the ANSANS function, which is accessed by pressing 2ndsecond followed by (-)left parenthesis minus right parenthesis.
Factorial
-
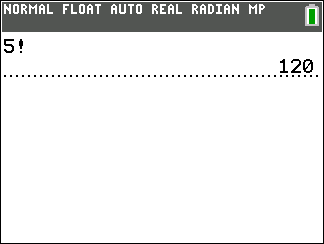
Enter the value for which you are calculating the factorial.
-
Press MATHMath and select PROBPROB from the top menu, then choose option !factorial. Press ENTEREnter key.
-
Press ENTEREnter key.
Permutation
-
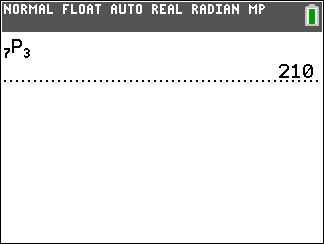
Enter the number of objects.
-
Press MATHMath and select PROBPROB from the top menu, then choose option nPrnPr. Press ENTEREnter key.
-
Enter the number of objects you are taking at a time.
-
Press ENTEREnter key.
Data Manipulation
Sorting
-
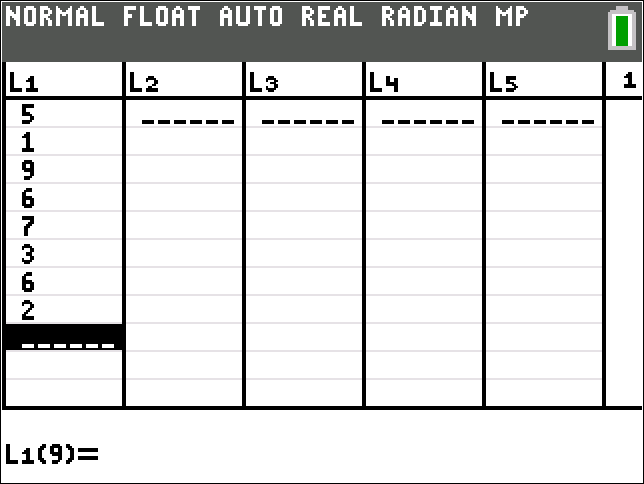
press STATSTAT, select EditEdit from the top menu, choose Edit...Edit horizontal ellipsis, and press ENTEREnter key.
-
Input the data in the column labeled L1L1, pressing ENTEREnter key after each value. See Adding Info to Lists for further help on entering your data.
-
-
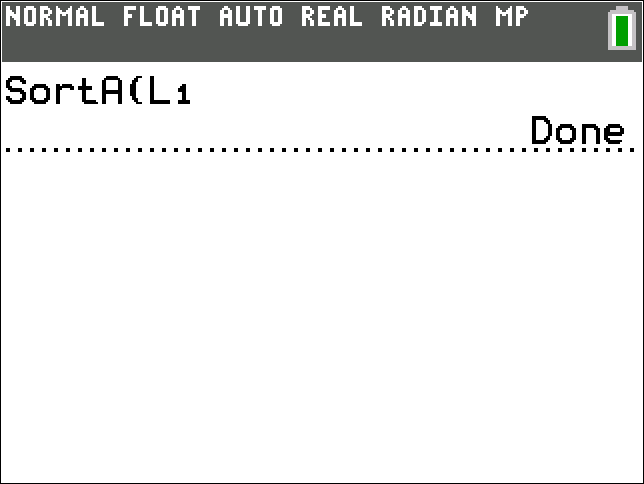
To sort the list in ascending order, press STATSTAT and select EditEdit from the top menu, then choose option SortA(SortA left parenthesis. Press ENTEREnter key.
-
To sort the list in descending order, press STATSTAT and select EditEdit from the top menu, then choose option SortD(SortD left parenthesis. Press ENTEREnter key.
-
-
Enter the name of the list to be sorted. Press ENTEREnter key.
Note that lists can be entered by pressing 2ndsecond followed by the number of the list. For example, 2ndsecond and 1one gives L1L1.
-
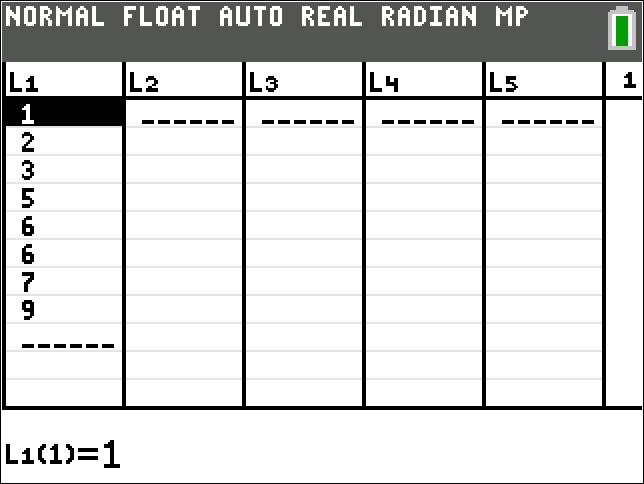
To view the sorted list, press STATSTAT, select EditEdit from the top menu, choose Edit...Edit horizontal ellipsis, and press ENTEREnter key.
Descriptive Statistics
One Variable
-
press STATSTAT, select EditEdit from the top menu, choose Edit...Edit horizontal ellipsis, and press ENTEREnter key.
-
Input the data in the column labeled L1L1, pressing ENTEREnter key after each value. See Adding Info to Lists for further help on entering your data.
-
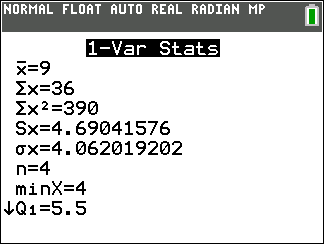
Press STATSTAT and select CALCCALC from the top menu, then choose option 1-Var Stats1 Var Stats. Press ENTEREnter key.
-
-
If prompted, verify the list entered is L1L1, select CalculateCalculate, and press ENTEREnter key.
-
If not prompted. Press ENTEREnter key.
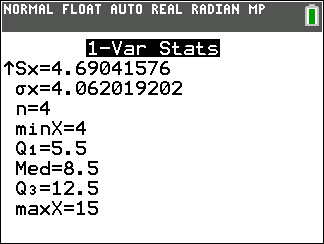
Note, L1L1 is the default list of data. If you wish to compute the descriptive statistics of another list of data, you may enter the list name by pressing 2ndsecond followed by the number of the list, and then press ENTEREnter key.
-
-
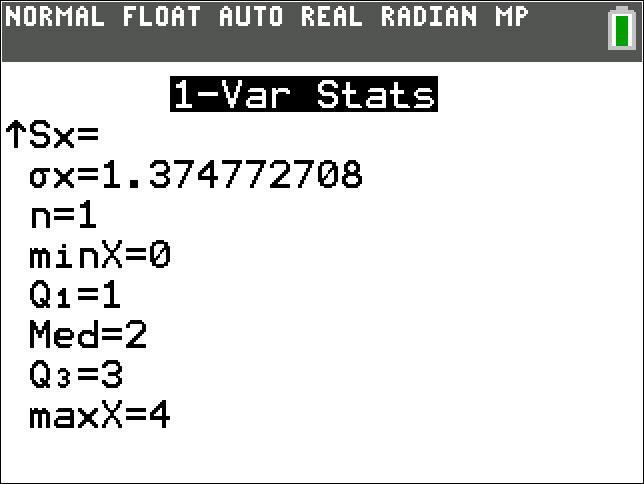
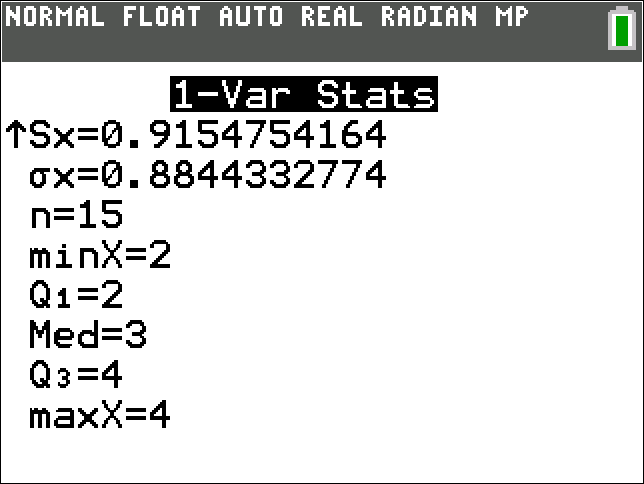
The values on the screen will be listed, in order, as follows.

Two Variable
Grouped Data
-
press STATSTAT, select EditEdit from the top menu, choose Edit...Edit horizontal ellipsis, and press ENTEREnter key.
-
-
Input the midpoints of the intervals in the column labeled L1L1, pressing ENTEREnter key after each value. See Adding Info to Lists for further help on entering your data.
-
Input the frequency values in the column labeled L2L2.
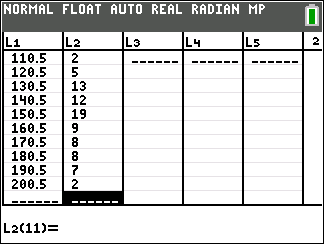
-
-
Press STATSTAT and select CALCCALC from the top menu, then choose option 1-Var Stats1 Var Stats. Press ENTEREnter key.
-
-
If prompted, verify the list entered is L1L1; for FreqListFreqlist, type L2L2; select CalculateCalculate; and press ENTEREnter key.
Note that lists can be entered by pressing 2ndsecond followed by the number of the list. For example, 2ndsecond and 2Two gives L2L2.
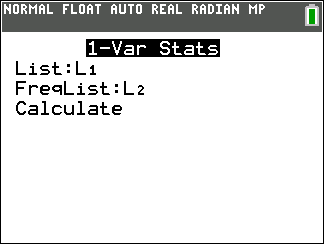
-
If not prompted, type L1,L2L1, L2.
Note that lists can be entered by pressing 2ndsecond followed by the number of the list. For example, 2ndsecond and 1one gives L1L1.
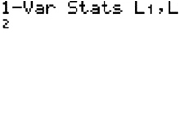
-
-
Press ENTEREnter key.
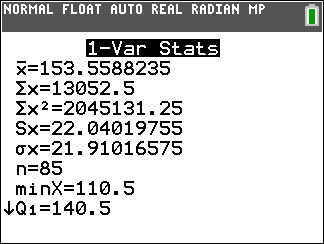
Variance of a Discrete Random Variable
-
press STATSTAT, select EditEdit from the top menu, choose Edit...Edit horizontal ellipsis, and press ENTEREnter key.
-
-
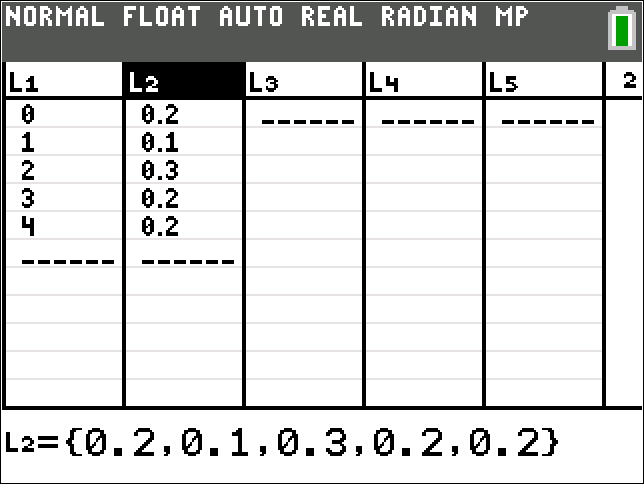
Input the x-values in the column labeled L1L1, pressing ENTEREnter key after each value. See Adding Info to Lists for further help on entering your data.
-
Input the probabilities in the column labeled L2L2.
-
-
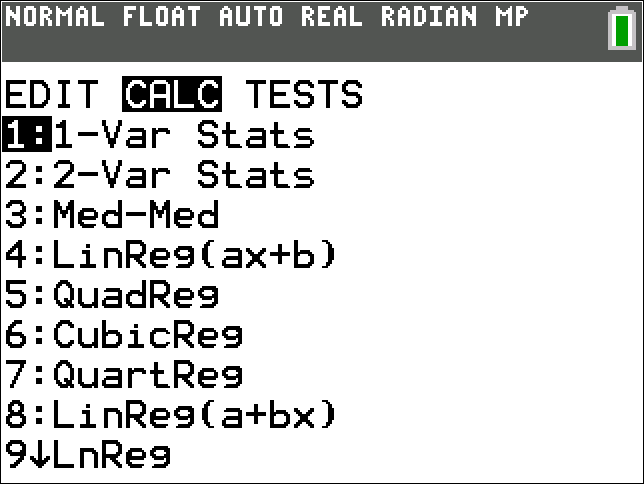
Press STATSTAT and select CALCCALC from the top menu, then choose option 1-Var Stats1 Var Stats. Press ENTEREnter key.
-
-
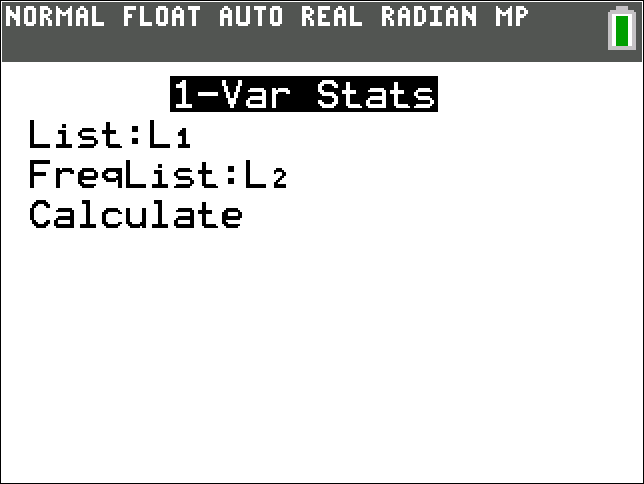
If prompted, verify the list entered is L1L1; for FreqListFreqlist, type L2L2; select CalculateCalculate; and press ENTEREnter key.
Note that lists can be entered by pressing 2ndsecond followed by the number of the list. For example, 2ndsecond and 2Two gives L2L2.
-
If not prompted, type L1,L2L1, L2.
Note that lists can be entered by pressing 2ndsecond followed by the number of the list. For example, 2ndsecond and 1one gives L1L1.
-
-
Press ENTEREnter key.
-
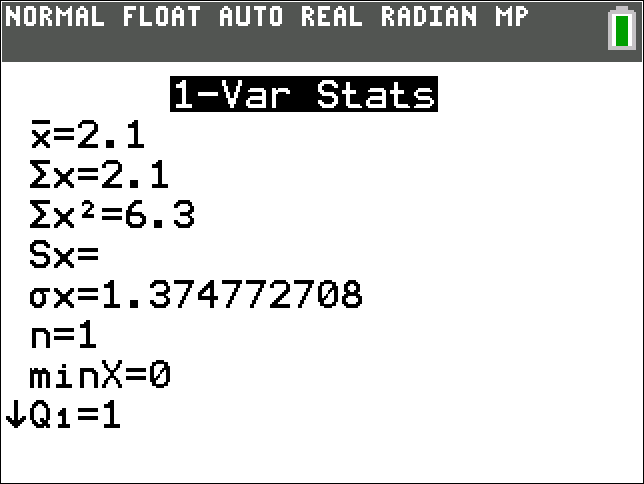
Note, the standard deviation is returned in the output after the label σxσ semicolon x, and the variance can be found by squaring this value.
Weighted Mean
-
press STATSTAT, select EditEdit from the top menu, choose Edit...Edit horizontal ellipsis, and press ENTEREnter key.
-
-
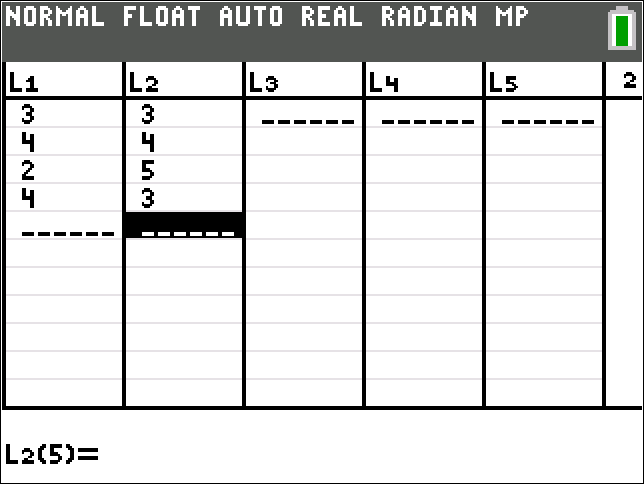
Input the weight values in the column labeled L1L1, pressing ENTEREnter key after each value. See Adding Info to Lists for further help on entering your data.
-
Input the frequency values in the column labeled L2L2.
-
-
Press STATSTAT and select CALCCALC from the top menu, then choose option 1-Var Stats1 Var Stats. Press ENTEREnter key.
-
-
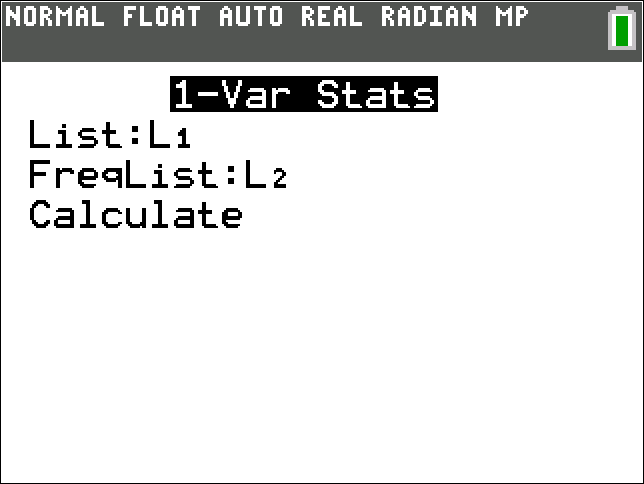
If prompted, verify the list entered is L1L1; for FreqListFreqlist, type L2L2; select CalculateCalculate; and press ENTEREnter key.
Note that lists can be entered by pressing 2ndsecond followed by the number of the list. For example, 2ndsecond and 2Two gives L2L2.
-
If not prompted, type L1,L2L1, L2.
Note that lists can be entered by pressing 2ndsecond followed by the number of the list. For example, 2ndsecond and 1one gives L1L1.
-
-
Press ENTEREnter key.
-
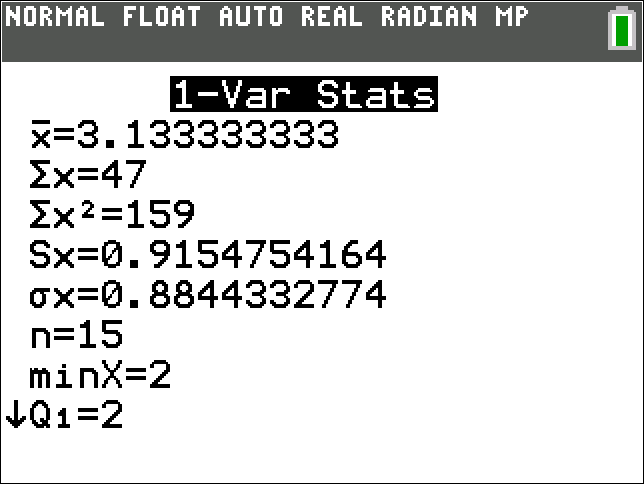
Note, the standard deviation is returned in the output after the label σxσ semicolon x, and the variance can be found by squaring this value.
F-Distribution
F-Probability (cdf)
-
Select DISTRDISTR by pressing 2nd2 less than sup greater than nd less than divided by sup greater than and then VARSvars.
-
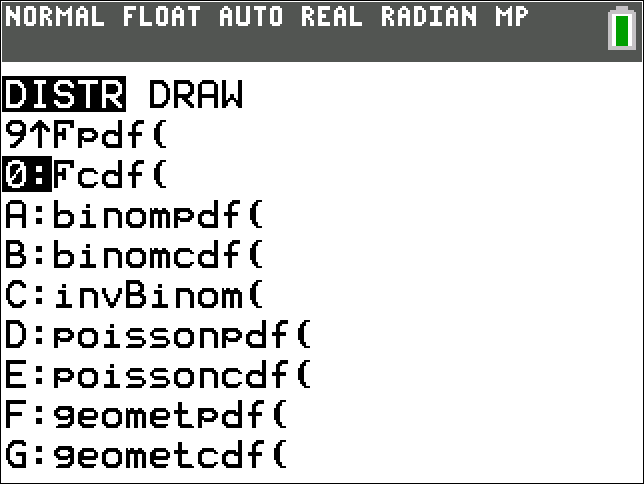
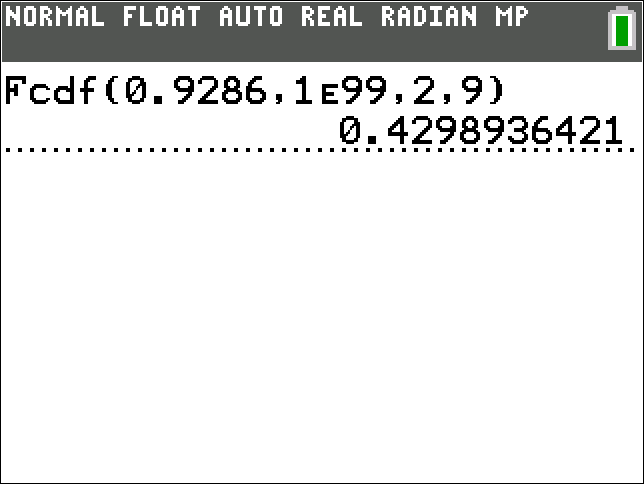
Scroll down to Fcdf(Fcdf left parenthesis. Press ENTEREnter key.
-
-
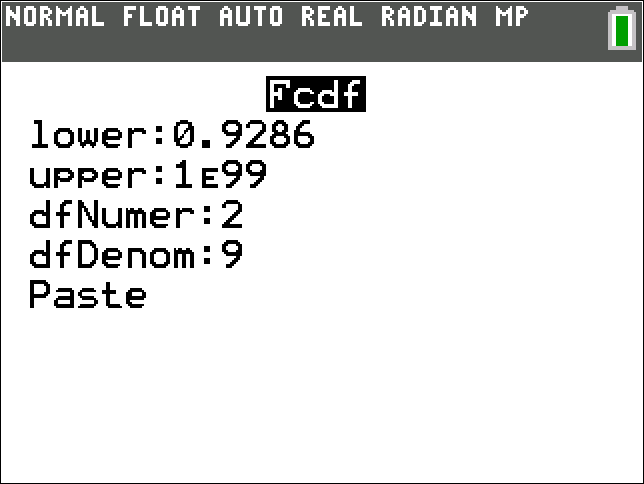
If prompted, input the lower F value, the upper F value, the numerator degrees of freedom, and the denominator degrees of freedom. Highlight PASTEPASTE and press ENTEREnter key.
Note, if your lower bound is negative infinity or your upper bound is positive infinity, use a very large negative or positive number such as -1E99negative 1E99 or 1E991E99. The symbol EE is entered by pressing 2ndsecond and then ,,.
-
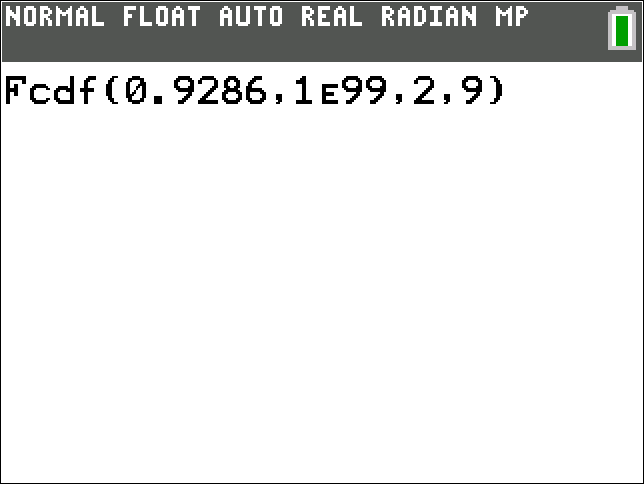
If not prompted, type the lower F value, the upper F value, the numerator degrees of freedom, and the denominator degrees of freedom separated by commas.
Note, if your lower bound is negative infinity or your upper bound is positive infinity, use a very large negative or positive number such as -1E99negative 1E99 or 1E991E99. The symbol EE is entered by pressing 2ndsecond and then ,,.
-
-
Press ENTEREnter key.
Graphs
Bar Charts
-
press STATSTAT, select EditEdit from the top menu, choose Edit...Edit horizontal ellipsis, and press ENTEREnter key.
-
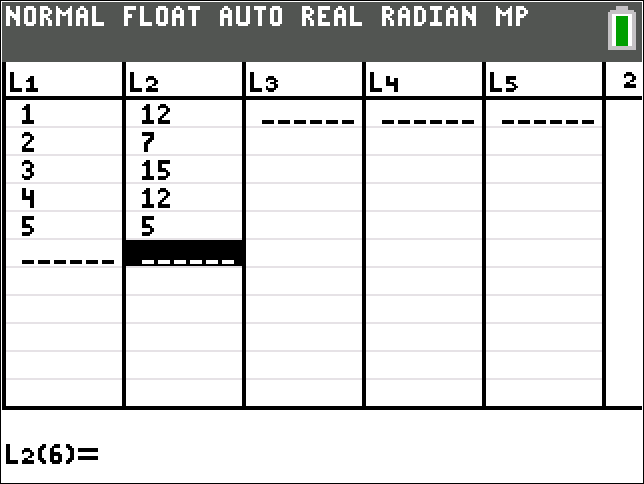
Enter your category data into list L1L1 and enter your frequency data into list L2L2. See Adding Info to Lists for further help on entering your data.
-
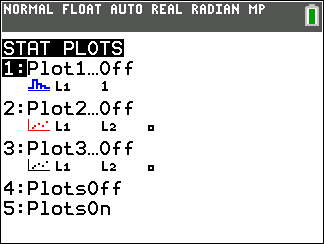
Choose STAT PLOTSTAT PLOT by pressing 2ndsecond and then Y=Y equals.
-
Highlight a plot and then press ENTEREnter key.
-
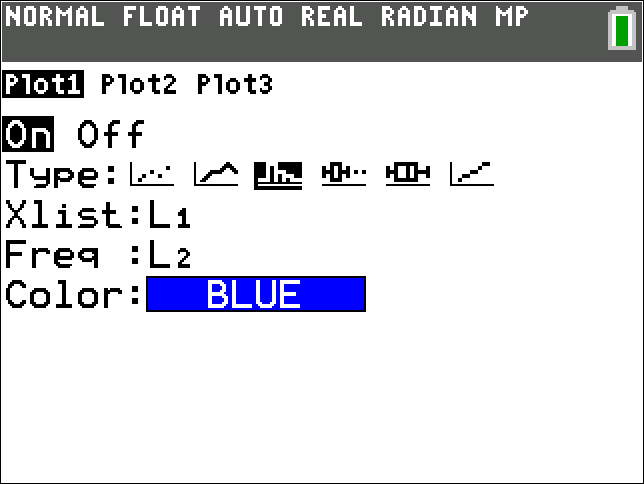
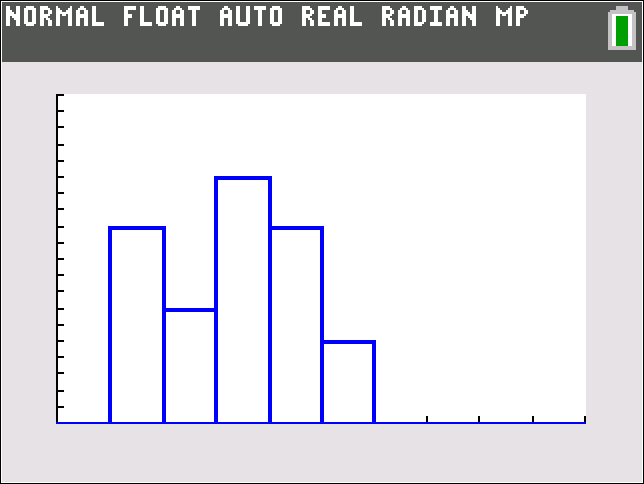
Select OnOn and the bar chart icon, which is the third option in the second row. For XlistX list, enter L1L1. For FreqFreq, enter L2L2.
Note that lists can be entered by pressing 2ndsecond followed by the number of the list. For example, 2ndsecond and 1one gives L1L1.
-
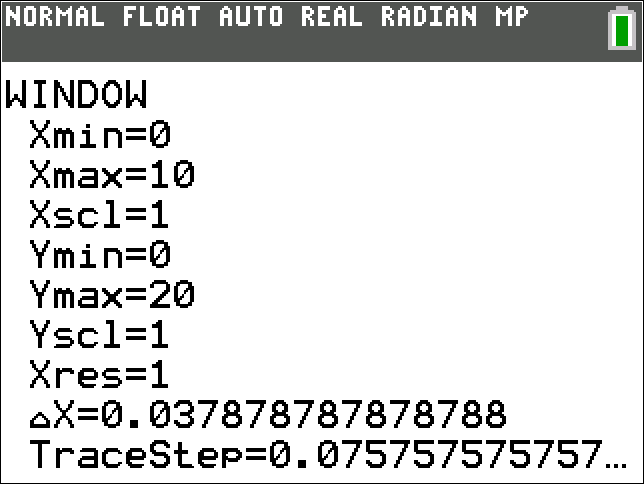
Press GRAPHGraph to display the bar chart. You can resize the graph by pressing WINDOWWindow to adjust the horizontal and vertical scales or by pressing ZOOMZoom and then choosing ZoomStat Zoom Stat.
Box Plot
-
press STATSTAT, select EditEdit from the top menu, choose Edit...Edit horizontal ellipsis, and press ENTEREnter key.
-
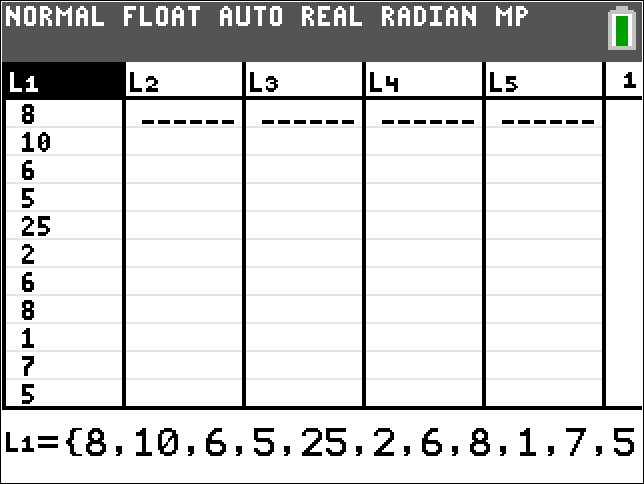
Input the data into a list, pressing ENTEREnter key after each value. See Adding Info to Lists for further help on entering your data.
-
Choose STAT PLOTSTAT PLOT by pressing 2ndsecond and then Y=Y equals.
-
Highlight a plot and then press ENTEREnter key.
-
Select OnOn.
-
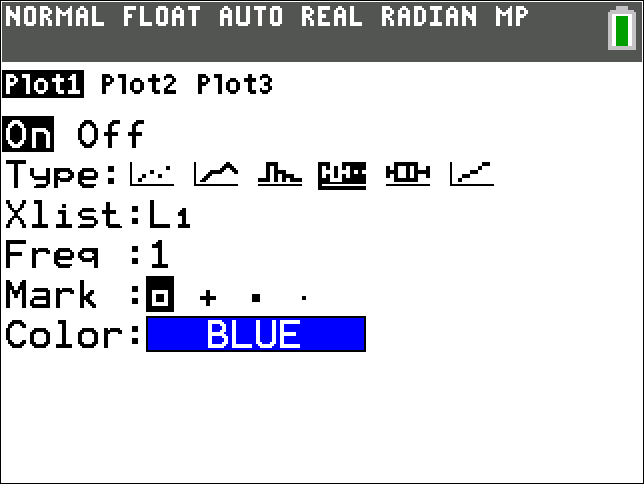
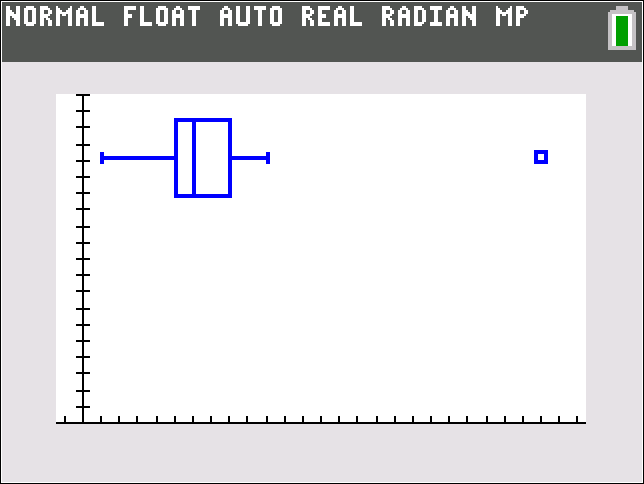
If you would like outliers to be plotted as points beyond the whiskers of the box plot, select the box plot icon that is the fourth option in the second row.
-
If you would like the whiskers of the box plot to extend to all points (even outliers), select the box plot icon that is the fifth option in the second row.
-
-
For XlistX list, enter the name of the list where the data is stored. For FreqFreq, enter 1one.
Note that lists can be entered by pressing 2ndsecond followed by the number of the list. For example, 2ndsecond and 1one gives L1L1.
-
Press GRAPHGraph to display the box plot. You can resize the graph by pressing WINDOWWindow to adjust the horizontal and vertical scales or by pressing ZOOMZoom and then choosing ZoomStat Zoom Stat.
Histogram
-
press STATSTAT, select EditEdit from the top menu, choose Edit...Edit horizontal ellipsis, and press ENTEREnter key.
-
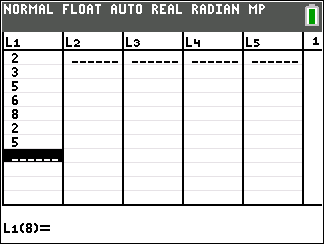
Input the data into a list, pressing ENTEREnter key after each value. See Adding Info to Lists for further help on entering your data.
-
Choose STAT PLOTSTAT PLOT by pressing 2ndsecond and then Y=Y equals.
-
Highlight a plot and then press ENTEREnter key.
-
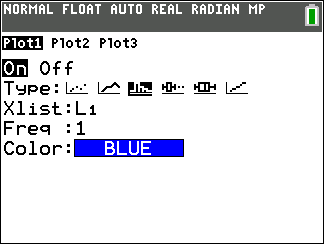
Select OnOn and the histogram icon, which is the third option in the second row. For XlistX list, enter the name of the list where the data is stored. For FreqFreq, enter 1one.
Note that lists can be entered by pressing 2ndsecond followed by the number of the list. For example, 2ndsecond and 1one gives L1L1.
-
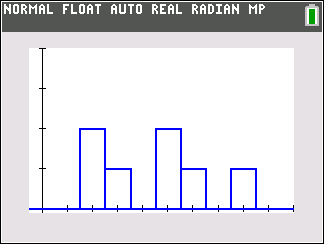
Press GRAPHGraph to display the histogram. You can resize the graph by pressing WINDOWWindow to adjust the horizontal and vertical scales or by pressing ZOOMZoom and then choosing ZoomStat Zoom Stat.
Line Graph
-
press STATSTAT, select EditEdit from the top menu, choose Edit...Edit horizontal ellipsis, and press ENTEREnter key.
-
Input the data into lists, pressing ENTEREnter key after each value. See Adding Info to Lists for further help on entering your data.

-
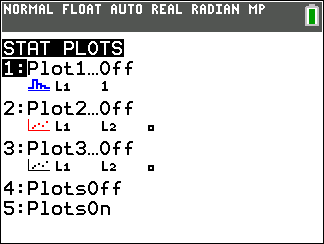
Choose STAT PLOTSTAT PLOT by pressing 2ndsecond and then Y=Y equals.
-
Highlight a plot and then press ENTEREnter key.
-
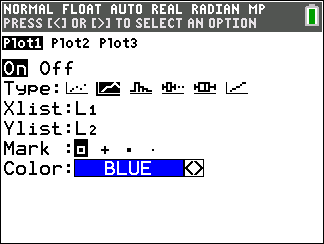
Select OnOn and the line graph icon, which is the second option in the second row. For XlistX list, enter the name of the list where the data to be graphed along the horizontal axis is stored. For YlistY list, enter the name of the list where the data to be graphed along the vertical axis is stored.
Note that lists can be entered by pressing 2ndsecond followed by the number of the list. For example, 2ndsecond and 1one gives L1L1.
-
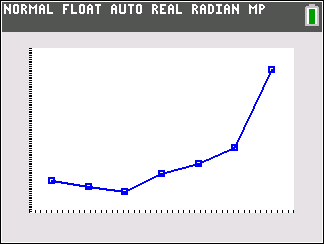
Press GRAPHGraph to display the line graph. You can resize the graph by pressing WINDOWWindow to adjust the horizontal and vertical scales or by pressing ZOOMZoom and then choosing ZoomStat Zoom Stat.
Normal Probability Plot
-
press STATSTAT, select EditEdit from the top menu, choose Edit...Edit horizontal ellipsis, and press ENTEREnter key.
-
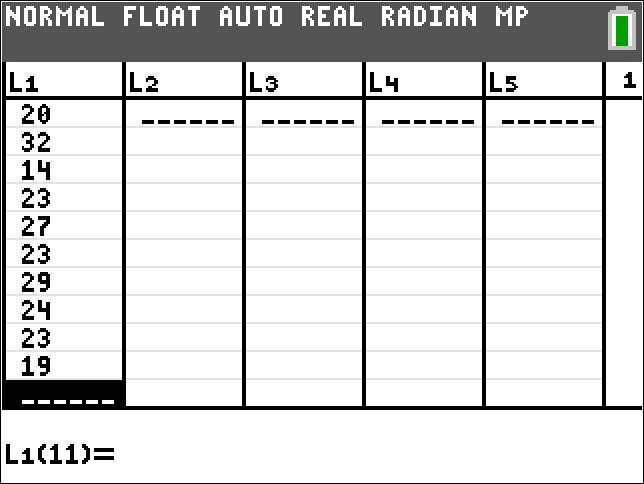
Input the data into lists, pressing ENTEREnter key after each value. See Adding Info to Lists for further help on entering your data.
-
Choose STAT PLOTSTAT PLOT by pressing 2ndsecond and then Y=Y equals.
-
Highlight a plot and then press ENTEREnter key.
-
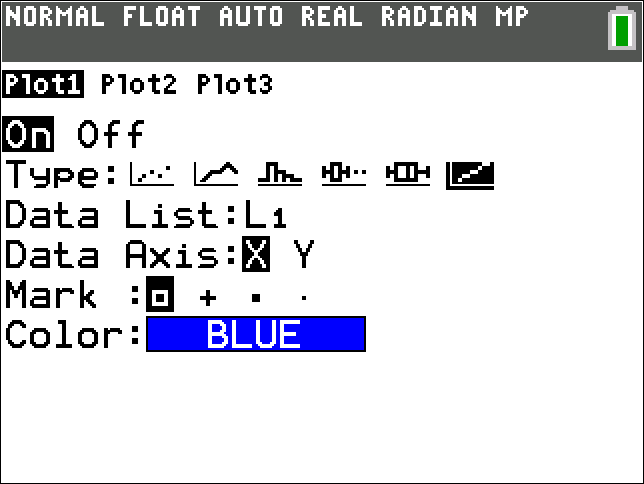
Select OnOn and the normal probability plot icon, which is the sixth option in the second row. For Data ListData List, enter the name of the list where the data to be graphed along the horizontal axis is stored. For Data AxisData Axis, select XX.
Note that lists can be entered by pressing 2ndsecond followed by the number of the list. For example, 2ndsecond and 1one gives L1L1.
-
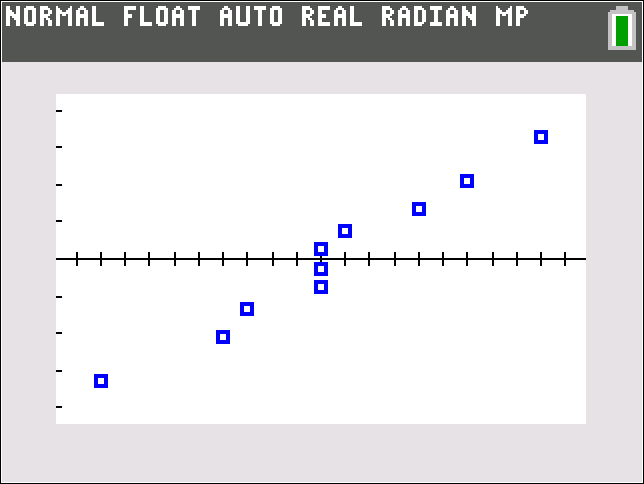
Press GRAPHGraph to display the line graph. You can resize the graph by pressing WINDOWWindow to adjust the horizontal and vertical scales or by pressing ZOOMZoom and then choosing ZoomStat Zoom Stat.
Pareto Charts
-
press STATSTAT, select EditEdit from the top menu, choose Edit...Edit horizontal ellipsis, and press ENTEREnter key.
-
Enter your category data into list L1L1 and enter your frequency data into list L2L2. See Adding Info to Lists for further help on entering your data.
-
Press STATSTAT and select EditEdit from the top menu, then choose option SortD(SortD left parenthesis. Press ENTEREnter key.
-
Enter L2L2. Press ENTEREnter key.
Note that lists can be entered by pressing 2ndsecond followed by the number of the list. For example, 2ndsecond and 2Two gives L2L2.
-
Choose STAT PLOTSTAT PLOT by pressing 2ndsecond and then Y=Y equals.
-
Highlight a plot and then press ENTEREnter key.
-
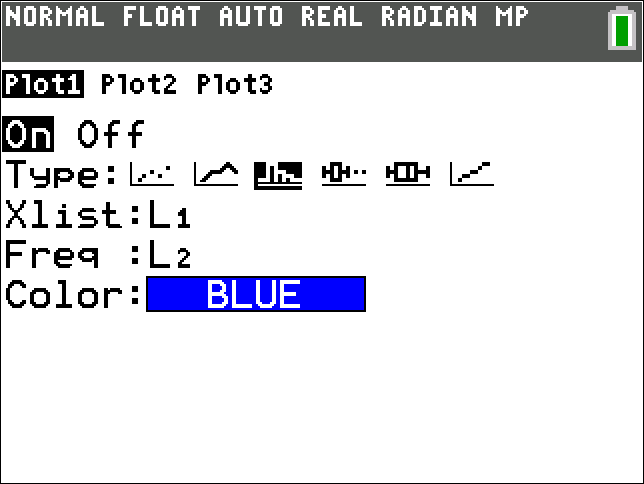
Select OnOn and the bar chart icon, which is the third option in the second row. For XlistX list, enter L1L1. For FreqFreq, enter L2L2.
-
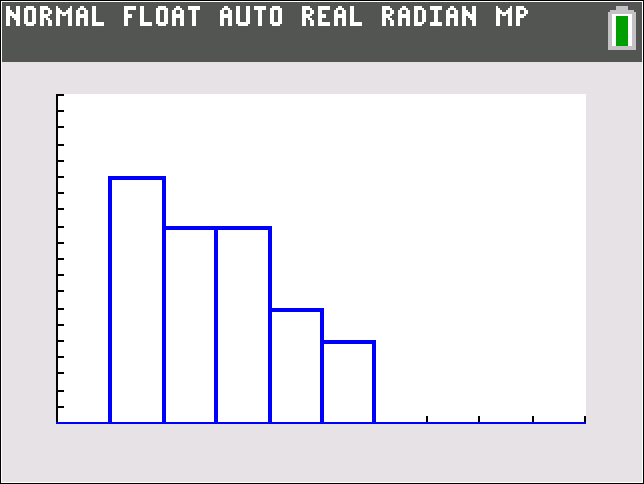
Press GRAPHGraph to display the bar chart. You can resize the graph by pressing WINDOWWindow to adjust the horizontal and vertical scales or by pressing ZOOMZoom and then choosing ZoomStat Zoom Stat.
Scatterplot
-
press STATSTAT, select EditEdit from the top menu, choose Edit...Edit horizontal ellipsis, and press ENTEREnter key.
-
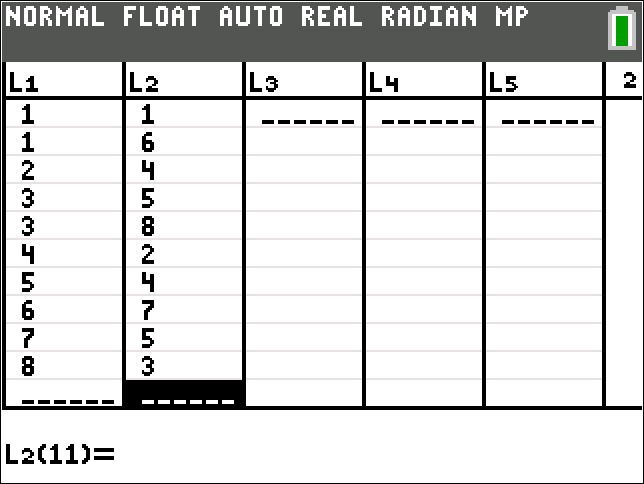
Enter x-coordinate data into list L1L1 and enter y-coordinate data into list L2L2. See Adding Info to Lists for further help on entering your data.
-
Choose STAT PLOTSTAT PLOT by pressing 2ndsecond and then Y=Y equals.
-
Highlight a plot and then press ENTEREnter key.
-
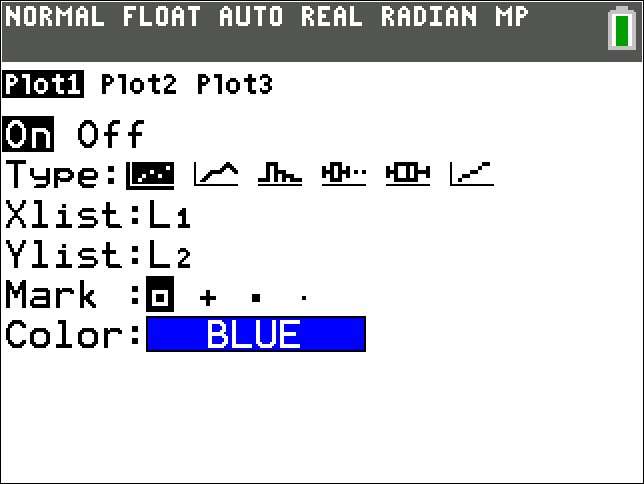
Select OnOn and the scatterplot icon, which is the first option in the second row. For XlistX list, enter L1L1. For YlistY list, enter L2L2.
Note that lists can be entered by pressing 2ndsecond followed by the number of the list. For example, 2ndsecond and 1one gives L1L1.
-
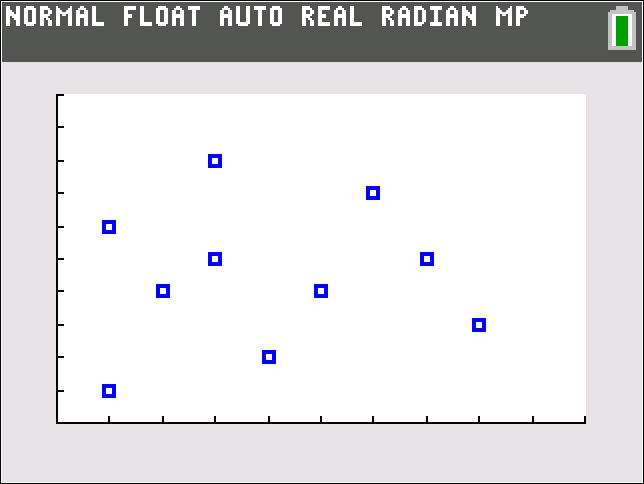
Press GRAPHGraph to display the scatterplot. You can resize the graph by pressing WINDOWWindow to adjust the horizontal and vertical scales or by pressing ZOOMZoom and then choosing ZoomStat Zoom Stat.
Time Series
See Line Graph.
Hypergeometric Distribution
Hypergeometric Distribution
See Combination.
Hypothesis Testing
One Proportion z-Test
-
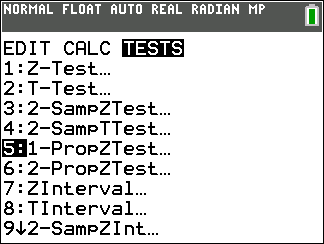
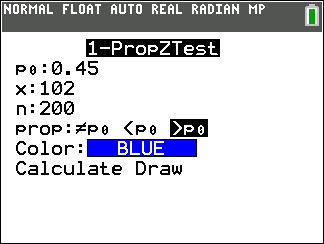
Press STATSTAT, select TESTSTESTS from the top menu, and scroll down to 1-PropZTest1 minus Prop ZTest. Press ENTEREnter key.
-
Input the proportion for the null hypothesis, the success count in the sample, and the sample size. Highlight the alternative hypothesis and press ENTEREnter key.
-
Select CalculateCalculate and press ENTEREnter key to observe the results of the test.
z-Test
Using Summary Statistics
-
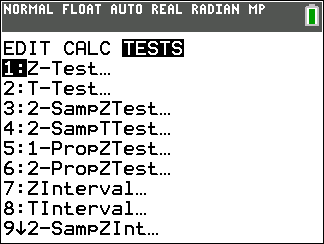
Press STATSTAT, select TESTSTESTS from the top menu, and scroll down to Z-TestZ minus Test. Press ENTEREnter key.
-
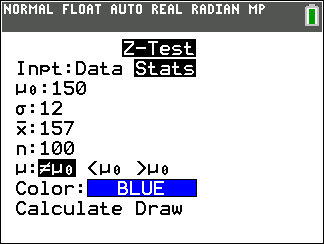
Choose StatsStats as the input and press ENTEREnter key.
-
Input the mean for the null hypothesis, the population standard deviation, the sample mean, and the sample size. Highlight the alternative hypothesis and press ENTEREnter key.
-
Select CalculateCalculate and then press ENTEREnter key to observe the results of the test.
Using Data
-
press STATSTAT, select EditEdit from the top menu, choose Edit...Edit horizontal ellipsis, and press ENTEREnter key.
-
Input the data into a list, pressing ENTEREnter key after each value. See Adding Info to Lists for further help on entering your data.
-
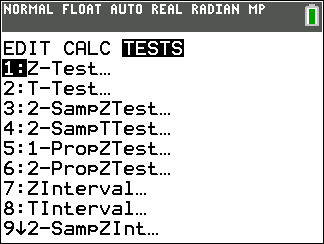
Press STATSTAT, select TESTSTESTS from the top menu, and scroll down to Z-TestZ minus Test. Press ENTEREnter key.
-
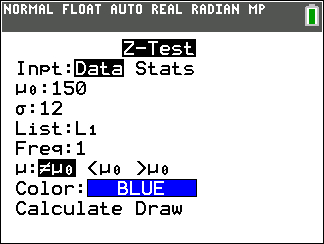
Choose DataData as the input and press ENTEREnter key.
-
Input the mean for the null hypothesis, the population standard deviation, and the list name where the data is stored. Highlight the alternative hypothesis and press ENTEREnter key.
Note that lists can be entered by pressing 2ndsecond followed by the number of the list. For example, 2ndsecond and 1one gives L1L1.
-
Select CalculateCalculate and then press ENTEREnter key to observe the results of the test.
t-Test
Using Summary Statistics
-
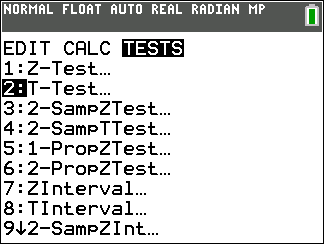
Press STATSTAT, select TESTSTESTS from the top menu, and scroll down to T-TestT minus Test. Press ENTEREnter key.
-
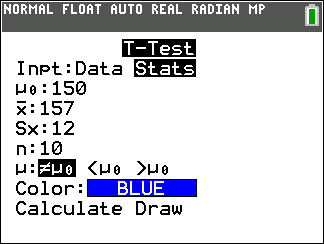
Choose StatsStats as the input and press ENTEREnter key.
-
Input the mean for the null hypothesis, the sample mean, the sample standard deviation, and the sample size. Highlight the alternative hypothesis and press ENTEREnter key.
-
Select CalculateCalculate and then press ENTEREnter key to observe the results of the test.
Using Data
-
press STATSTAT, select EditEdit from the top menu, choose Edit...Edit horizontal ellipsis, and press ENTEREnter key.
-
Input the data into a list, pressing ENTEREnter key after each value. See Adding Info to Lists for further help on entering your data.
-
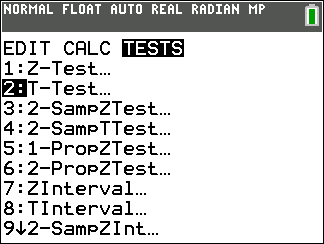
Press STATSTAT, select TESTSTESTS from the top menu, and scroll down to T-TestT minus Test. Press ENTEREnter key.
-
Choose DataData as the input and press ENTEREnter key.
-
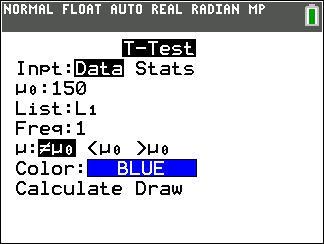
Input the mean for the null hypothesis and the list name where the data is stored. Highlight the alternative hypothesis and press ENTEREnter key.
Note that lists can be entered by pressing 2ndsecond followed by the number of the list. For example, 2ndsecond and 1one gives L1L1.
-
Select CalculateCalculate and then press ENTEREnter key to observe the results of the test.
Two Proportion z-Test
-
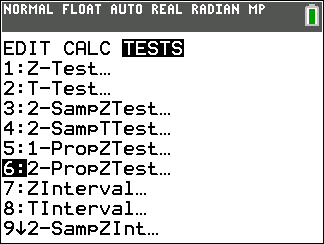
Press STATSTAT, select TESTSTESTS from the top menu, and scroll down to 2-PropZTest2 minus PropZTest. Press ENTEREnter key.
-
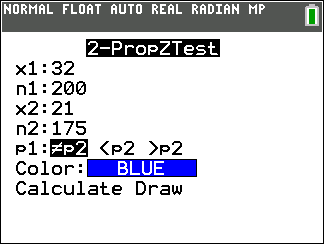
Input the success count and the sample size for sample 1 and 2. Highlight the alternative hypothesis and press ENTEREnter key.
-
Select CalculateCalculate and press ENTEREnter key to observe the results of the test.
Two Sample t-Test (Independent Samples)
Using Summary Statistics
-
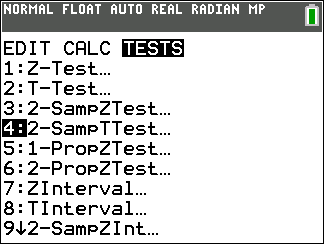
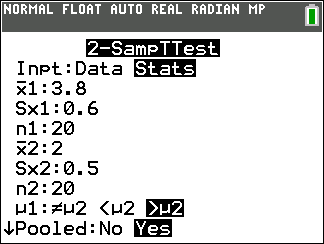
Press STATSTAT, select TESTSTESTS from the top menu, and scroll down to 2-SampTTest2 minus SampTTest. Press ENTEREnter key.
-
Choose StatsStats as the input and press ENTEREnter key.
-
Input the sample mean, the sample standard deviation, and the sample size for sample 1 and 2. Highlight the alternative hypothesis and press ENTEREnter key.
For Pooled:Pooled colon choose “Yes” when assuming the population variances are equal and choose “No” when assuming the population variances are not equal.
-
Select CalculateCalculate and then press ENTEREnter key to observe the results of the test.
Note: Many calculators use an alternate formula for the number of degrees of freedom so solutions may vary.
Using Data
-
press STATSTAT, select EditEdit from the top menu, choose Edit...Edit horizontal ellipsis, and press ENTEREnter key.
-
-
Input the data for Sample 1 under L1L1, pressing ENTEREnter key after each value. See Adding Info to Lists for further help on entering your data.
-
Input the data for Sample 2 under L2L2, pressing ENTEREnter key after each value.
-
-
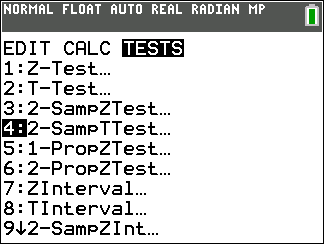
Press STATSTAT, select TESTSTESTS from the top menu, and scroll down to 2-SampTTest2 minus SampTTest. Press ENTEREnter key.
-
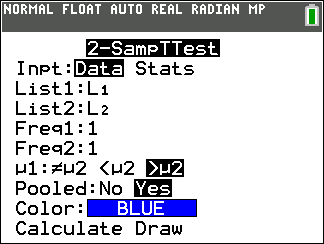
Choose DataData as the input and press ENTEREnter key.
-
Input the list names where the data is stored. Note that lists can be entered by pressing 2ndsecond followed by the number of the list. For example, 2ndsecond and 1one gives L1L1.
Highlight the alternative hypothesis and press ENTEREnter key.
For Pooled:Pooled colon choose “Yes” when assuming population variances are equal and choose “No” when assuming the population variances are not equal.
-
Select CalculateCalculate and then press ENTEREnter key to observe the results of the test.
Note: Many calculators use an alternate formula for the number of degrees of freedom so solutions may vary.
Two Sample t-Test (Dependent Samples, Paired Difference)
Using Summary Statistics
See t-Test, using Summary Statistics.
Using Data
-
press STATSTAT, select EditEdit from the top menu, choose Edit...Edit horizontal ellipsis, and press ENTEREnter key.
-
Input the data for Sample 1 (before data) in the column labeled L1L1, pressing ENTEREnter key after each value. Input the data for Sample 2 (after data) in the column labeled L2L2, pressing ENTEREnter key after each value. See Adding Info to Lists for further help on entering your data.
-
Highlight L3L3 and enter the formula L2L2 − L1L1 and then ENTEREnter key.
Note that lists can be entered by pressing 2ndsecond followed by the number of the list. For example, 2ndsecond and 1one gives L1L1.
-
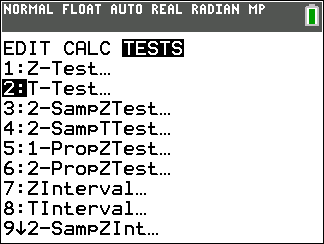
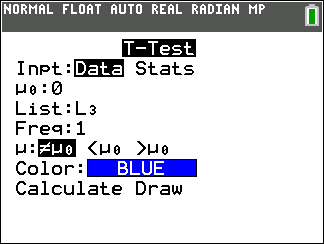
Press STATSTAT and select TESTSTESTS from the top menu, then scroll down to option T-TestT minus Test. Press ENTEREnter key.
-
Choose DataData as the input and press ENTEREnter key.
-
Input the mean for the null hypothesis and the list name where the data is stored. Highlight the alternative hypothesis and press ENTEREnter key.
Note that lists can be entered by pressing 2ndsecond followed by the number of the list. For example, 2ndsecond and 3Three gives L3L3.
-
Select CalculateCalculate and press ENTEREnter key to observe the results of the test.
Two Sample z-Test
Using Summary Statistics
-
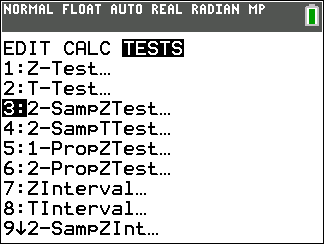
Press STATSTAT, select TESTSTESTS from the top menu, and scroll down to 2-SampZTest2 minus SampZTest. Press ENTEREnter key.
-
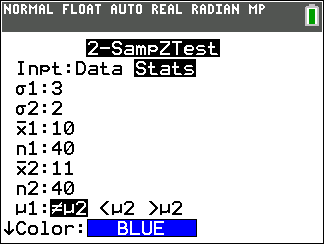
Choose StatsStats as the input and press ENTEREnter key.
-
Input the population standard deviation, the sample mean, and the sample size for each sample. Highlight the alternative hypothesis and press ENTEREnter key.
-
Select CalculateCalculate and then press ENTEREnter key to observe the results of the test.
Using Data
-
press STATSTAT, select EditEdit from the top menu, choose Edit...Edit horizontal ellipsis, and press ENTEREnter key.
-
-
Input the data for Sample 1 under L1L1, pressing ENTEREnter key after each value. See Adding Info to Lists for further help on entering your data.
-
Input the data for Sample 2 under L2L2, pressing ENTEREnter key after each value.
-
-
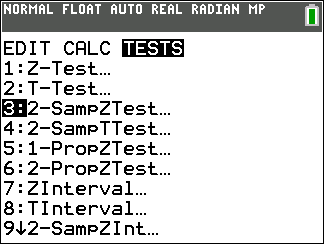
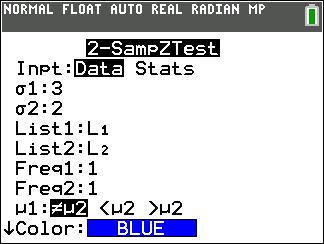
Press STATSTAT, select TESTSTESTS from the top menu, and scroll down to 2-SampZTest2 minus SampZTest. Press ENTEREnter key.
-
Choose DataData as the input and press ENTEREnter key.
-
Input the population standard deviation for both populations, and the list names where the data is stored. Highlight the alternative hypothesis and press ENTEREnter key.
Note that lists can be entered by pressing 2ndsecond followed by the number of the list. For example, 2ndsecond and 1one gives L1L1.
-
Select CalculateCalculate and then press ENTEREnter key to observe the results of the test.
Two Sample F-Test
Using Summary Statistics
-
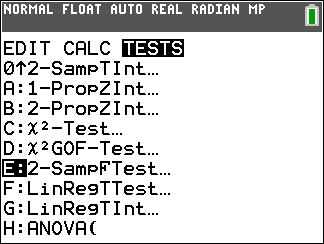
Press STATSTAT, select TESTSTESTS from the top menu, and scroll down to 2-SampFTest2 minus SampFTest. Press ENTEREnter key.
-
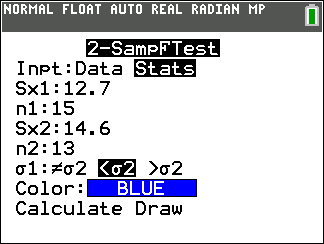
Choose StatsStats as the input and press ENTEREnter key.
-
Input the sample standard deviation and the sample size for each sample. Highlight the alternative hypothesis and press ENTEREnter key.
-
Select CalculateCalculate and then press ENTEREnter key to observe the results of the test.
Using Data
-
press STATSTAT, select EditEdit from the top menu, choose Edit...Edit horizontal ellipsis, and press ENTEREnter key.
-
-
Input the data for Sample 1 under L1L1, pressing ENTEREnter key after each value. See Adding Info to Lists for further help on entering your data.
-
Input the data for Sample 2 under L2L2, pressing ENTEREnter key after each value.
-
-
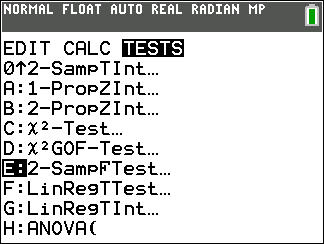
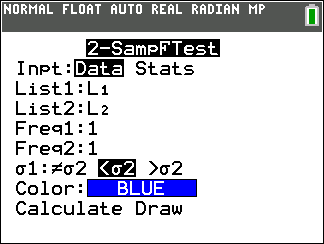
Press STATSTAT, select TESTSTESTS from the top menu, and scroll down to 2-SampFTest2 minus SampFTest. Press ENTEREnter key.
-
Choose DataData as the input and press ENTEREnter key.
-
Input the list names where the data is stored. Highlight the alternative hypothesis and press ENTEREnter key.
Note that lists can be entered by pressing 2ndsecond followed by the number of the list. For example, 2ndsecond and 1one gives L1L1.
-
Select CalculateCalculate and then press ENTEREnter key to observe the results of the test.
Normal Distribution
Inverse Normal
-
Select DISTRDISTR by pressing 2nd2 less than sup greater than nd less than divided by sup greater than and then VARSvars.
-
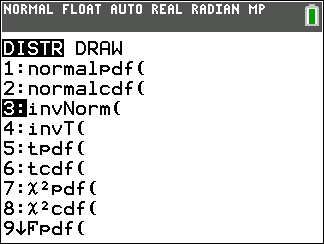
Scroll down to invNorm(invNorm. Press ENTEREnter key.
-
-
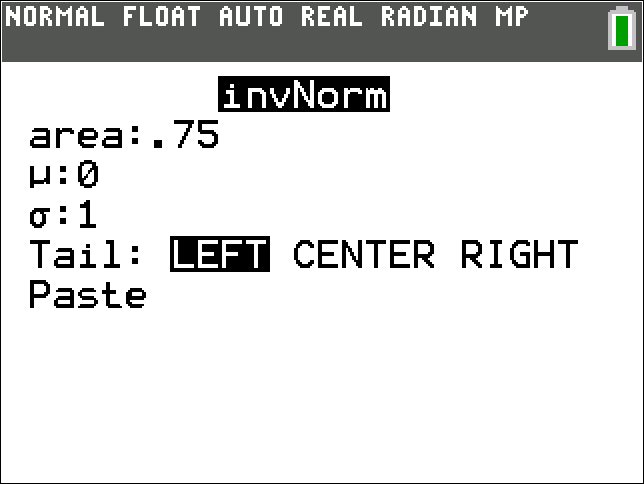
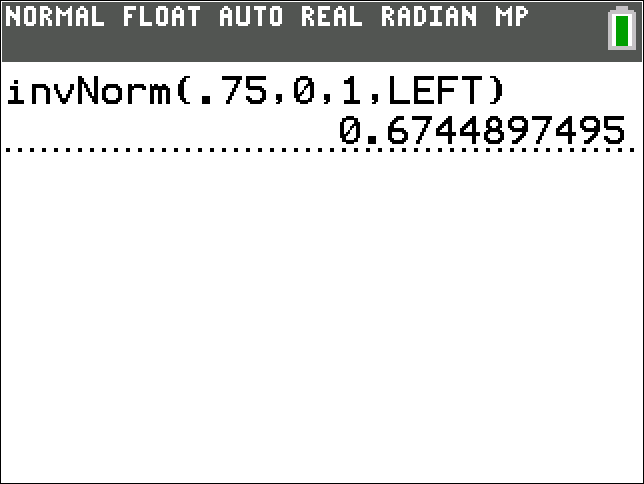
If prompted, input the area, the mean, and the standard deviation. Highlight "LEFT", "CENTER", or "RIGHT", depending on whether you would like the z-value(s) with the given area to the left, center, or right, and press ENTEREnter key. Highlight PASTEPASTE and press ENTEREnter key.
-
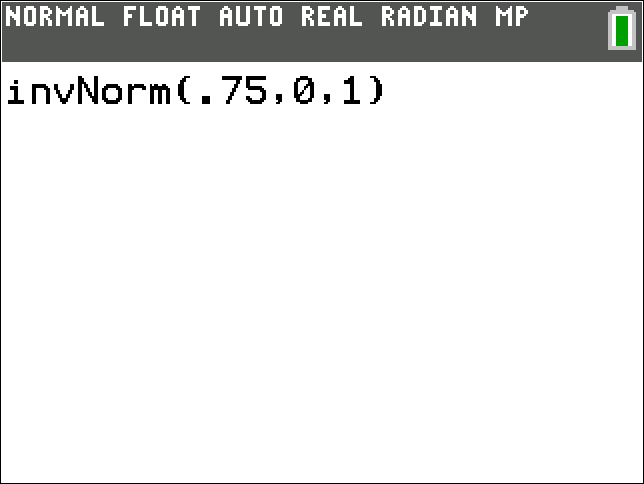
If not prompted, type the area to the left of z, the mean, and the standard deviation separated by commas.
Note, if given the area to the right of z, subtract that value from 1.
-
-
Press ENTEREnter key.
Normal Probability (cdf)
-
Select DISTRDISTR by pressing 2nd2 less than sup greater than nd less than divided by sup greater than and then VARSvars.
-
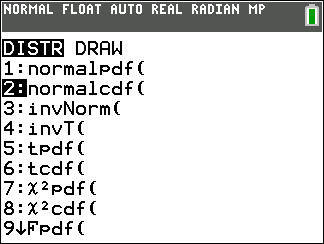
Scroll down to normalcdf(normalcdf. Press ENTEREnter key.
-
-
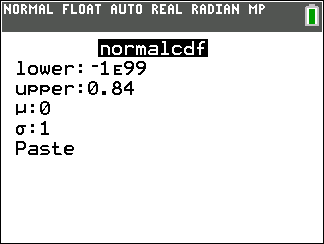
If prompted, input the lower x or z value, the upper x or z value, the mean, and the standard deviation. Highlight PASTEPASTE and press ENTEREnter key.
Note, if your lower bound is negative infinity or your upper bound is positive infinity, use a very large negative or positive number such as -1E99negative 1E99 or 1E991E99. The symbol EE is entered by pressing 2ndsecond and then ,,.
-
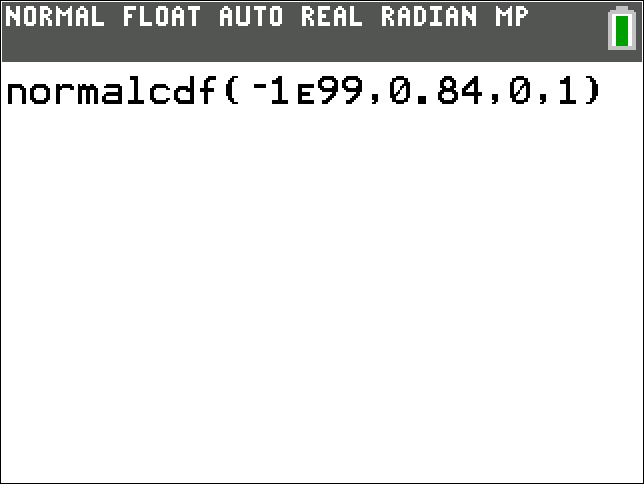
If not prompted, type the lower x or z value, the upper x or z value, the mean, and the standard deviation separated by commas.
Note, if your lower bound is negative infinity or your upper bound is positive infinity, use a very large negative or positive number such as -1E99negative 1E99 or 1E991E99. The symbol EE is entered by pressing 2ndsecond and then ,,.
-
-
Press ENTEREnter key.
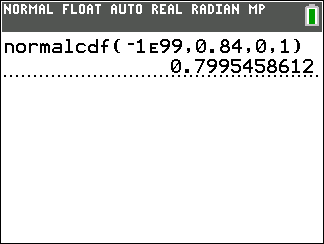
Normal Probability Graph
-
To properly view the graph, you may need to first adjust the window. Press WINDOWWINDOW.
-
Recommended bounds for Xmin and Xmax are ±3σ with Xscl = σ.
-
Let Ymin = -0.1, and Ymax = 1 with Yscl = 0.1.
-
-
Select DISTRDISTR by pressing 2nd2 less than sup greater than nd less than divided by sup greater than and then VARSvars.
-
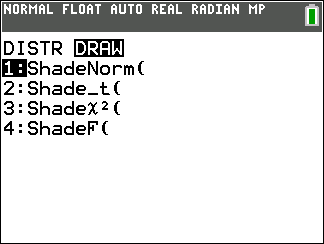
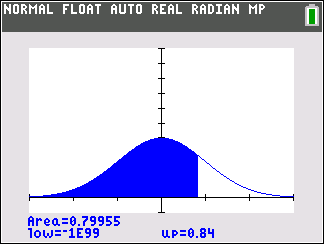
Select DRAWDRAW from the top menu and scroll down to ShadeNorm(ShadeNorm left parenthesis. Press ENTEREnter key.
-
-
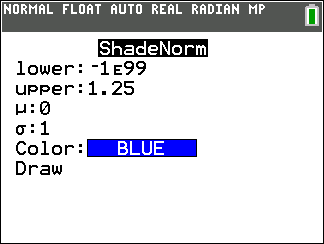
If prompted, input the lower x or z value, the upper x or z value, the mean, and the standard deviation. Select DRAWDRAW.
Note, if your lower bound is negative infinity or your upper bound is positive infinity, use a very large negative or positive number such as -1E99negative 1E99 or 1E991E99. The symbol EE is entered by pressing 2ndsecond and then ,,.
-
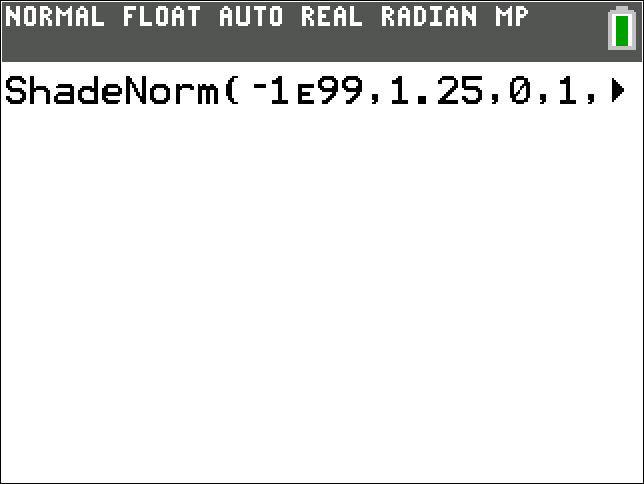
If not prompted, type the lower x or z value, the upper x or z value, the mean, and the standard deviation separated by commas.
Note, if your lower bound is negative infinity or your upper bound is positive infinity, use a very large negative or positive number such as -1E99negative 1E99 or 1E991E99. The symbol EE is entered by pressing 2ndsecond and then ,,.
-
-
Press ENTEREnter key.
Test for Normality
-
-
The data is likely normally distributed, if the points on the plot cluster closely around a straight line.
-
The data is likely not normally distributed, if the points deviate significantly from a straight line.
-
Poisson Distribution
Poisson Probability (cdf)
-
Select DISTRDISTR by pressing 2nd2 less than sup greater than nd less than divided by sup greater than and then VARSvars.
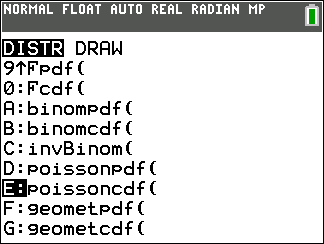
-
Scroll down to option poissoncdf(poissoncdf left parenthesis. Press ENTEREnter key.
-
-
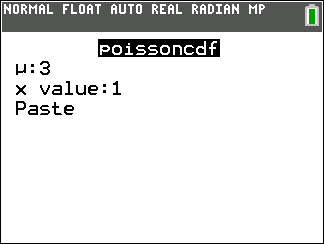
If prompted, input the mean and the number of successes. Highlight PASTEPASTE and press ENTEREnter key.
-
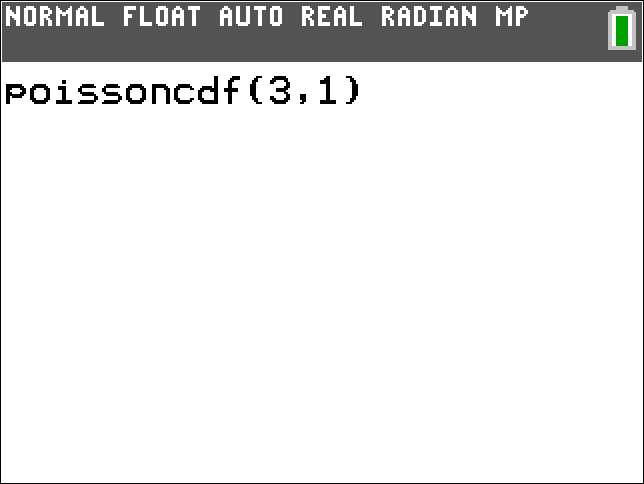
If not prompted, type the mean and the number of successes separated by a comma.
-
-
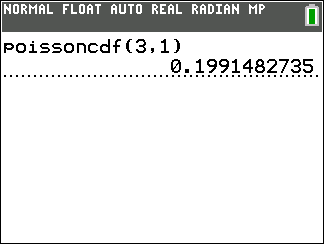
Press ENTEREnter key to display the cumulative probability.
Poisson Probability (pdf)
-
Select DISTRDISTR by pressing 2nd2 less than sup greater than nd less than divided by sup greater than and then VARSvars.
-
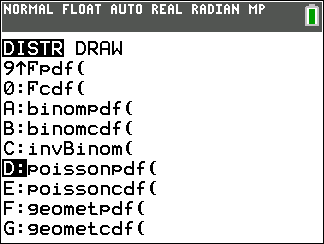
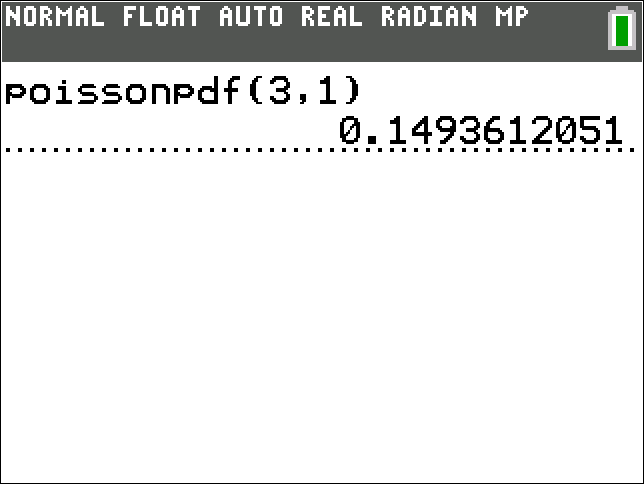
Scroll down to option poissonpdf(poissonpdf left parenthesis. Press ENTEREnter key.
-
-
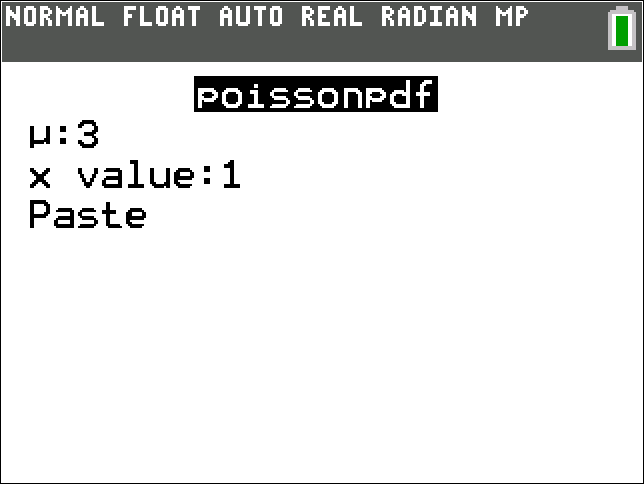
If prompted, input the mean and the number of successes. Highlight PASTEPASTE and press ENTEREnter key.
-
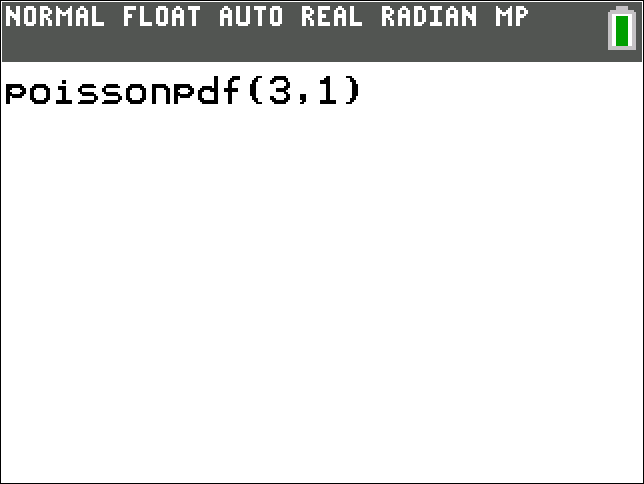
If not prompted, type the mean and the number of successes separated by a comma.
-
-
Press ENTEREnter key to display the probability.
Poisson Probability Distribution
-
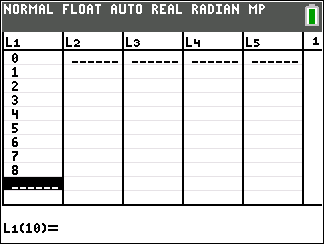
press STATSTAT, select EditEdit from the top menu, choose Edit...Edit horizontal ellipsis, and press ENTEREnter key. See Adding Info to Lists for further help on entering your data.
-
Input the values 0 to n in L1L1.
-
Press QUITQUIT by pressing 2ndsecond and then MODEMODE.
-
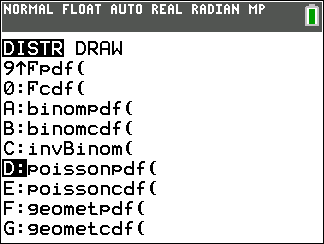
Select DISTRDISTR by pressing 2nd2 less than sup greater than nd less than divided by sup greater than and then VARSvars.
-
Scroll down to option poissonpdf(poissonpdf left parenthesis. Press ENTEREnter key.
-
-
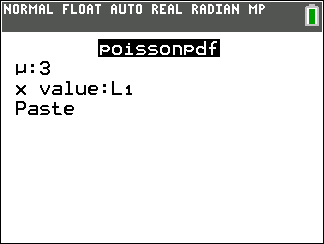
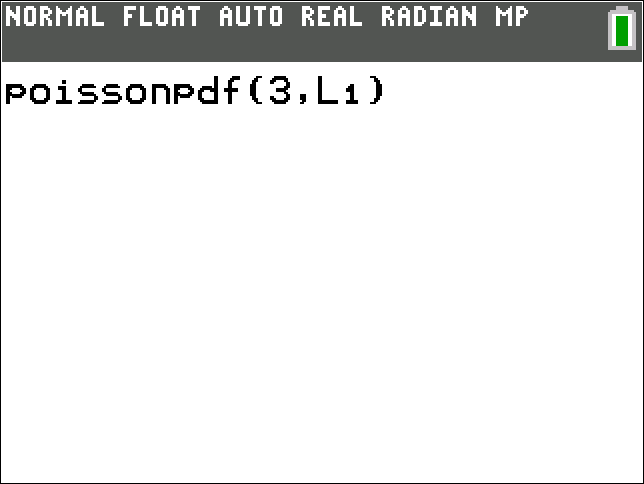
If prompted, input the mean. Enter L1L1 as the probability of success by pressing 2ndsecond and then 1one. Highlight PASTEPASTE and then press ENTEREnter key.
-
If not prompted, type the mean, a comma, and L1L1.
Note, to type L1L1 press 2ndsecond and then 1one.
-
-
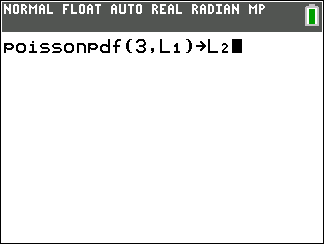
Then store the probabilities in L2L2, press STO→STO→ semicolon, then 2nd2 less than sup greater than nd less than divided by sup greater than, and then 2Two. Press ENTEREnter key.
-
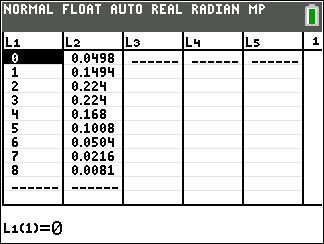
To view the distribution table, press STATSTAT, select EditEdit from the top menu, choose Edit...Edit horizontal ellipsis, and press ENTEREnter key.
Regression
Confidence Interval for Slope
(Not available on all TI models)
-
press STATSTAT, select EditEdit from the top menu, choose Edit...Edit horizontal ellipsis, and press ENTEREnter key. See Adding Info to Lists for further help on entering your data.
-
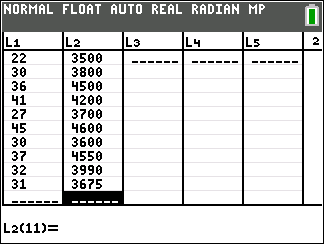
Enter the x-values into L1L1 (pressing ENTEREnter key after each value), and the y-values into L2L2.
-
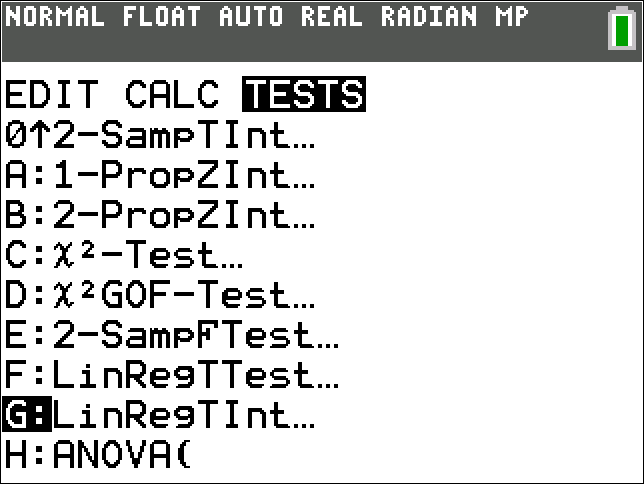
Press STATSTAT, select TESTSTESTS from the top menu, and scroll down to LinRegTIntLinRegTInt. Press ENTEREnter key.
-
-
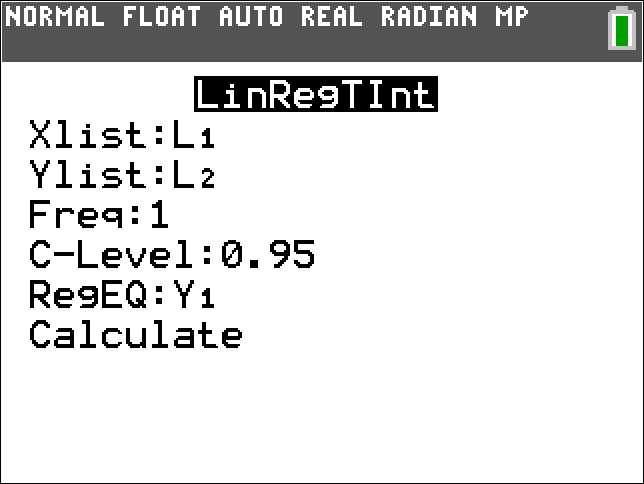
Verify XlistX list is L1L1, YlistY list is L2L2, and FreqFreq is 1one.
Note that lists can be entered by pressing 2ndsecond followed by the number of the list. For example, 2ndsecond and 1one gives L1L1.
-
Input the confidence level.
-
For RegEQ Reg EQ, enter Y1Y1 by pressing VARSvars, selecting Y-VarsY minus Vars from the top menu, scrolling down to Function...Function horizontal ellipsis, and pressing ENTEREnter key. Choose Y1Y1 from the list and press ENTEREnter key.
-
Highlight CalculateCalculate.
-
-
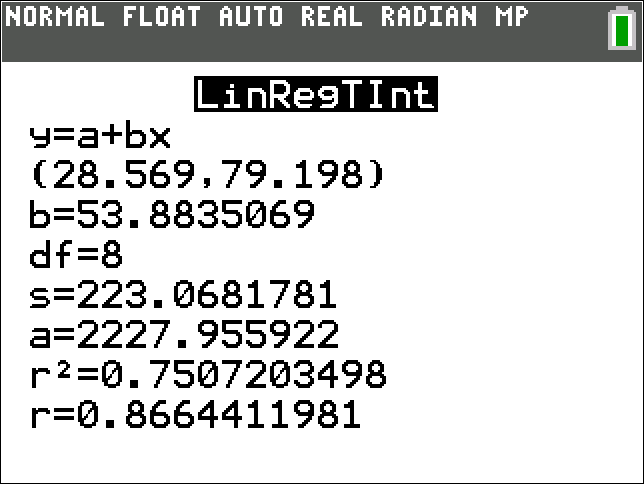
Press ENTEREnter key.
Hypothesis Testing for Slope Coefficient
Correlation Coefficient and Coefficient of Determination
For the correlation coefficient (r) and the coefficient of determination (r2) to appear in the output for the linear regression function, the following steps must be taken.
Note: These directions update a setting in your calculator and do not need to be followed every time the linear regression function is run to find r and r2.
-
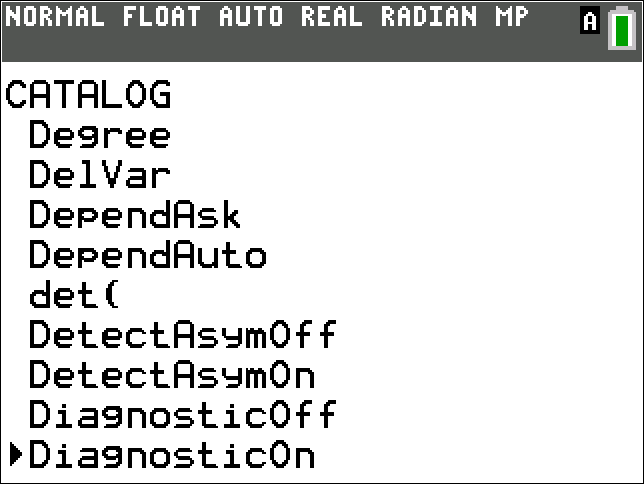
Select CATALOGCATALOG by pressing 2ndsecond and then 0zero.
-
Scroll down to DiagnosticOnDiagnosticOn. Press ENTEREnter key.
-
Press ENTEREnter key again and observe that the screen says "Done".
-
Follow the instructions for Simple Linear Regression.
Simple Linear Regression
Finding the Regression Line
-
press STATSTAT, select EditEdit from the top menu, choose Edit...Edit horizontal ellipsis, and press ENTEREnter key. See Adding Info to Lists for further help on entering your data.
-
Enter the x-values into L1L1 (pressing ENTEREnter key after each value), and the y-values into L2L2.
-
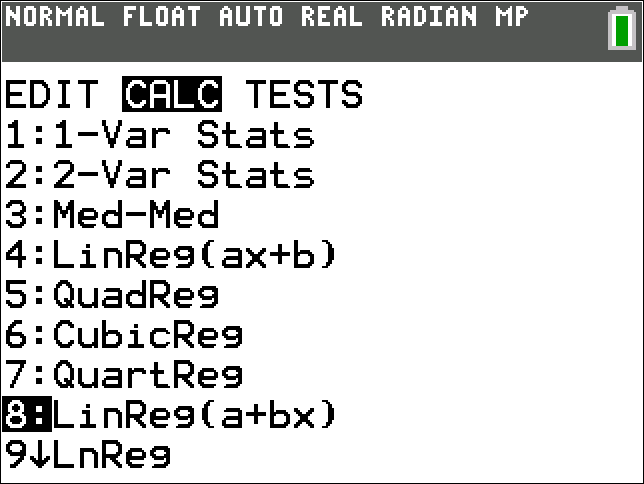
Press STATSTAT, select CALCCALC from the top menu, and scroll down to LinReg(a+bX)Linreg left parenthesis a plus b x right parenthesis. Press ENTEREnter key.
Note, LinReg(ax+b)Linreg left parenthesis ax plus b right parenthesis is an alternate option. It is mathematically identical and differs only in the order in which the answer is written.
-
-
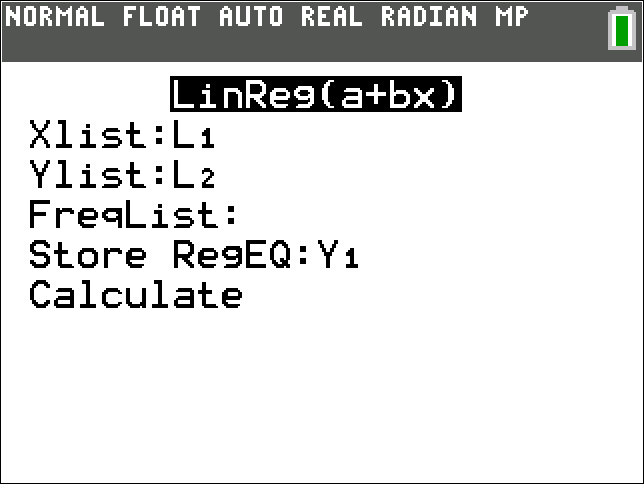
If prompted, for XlistX list, type L1L1; and for YlistY list, type L2L2. Note that lists can be entered by pressing 2ndsecond followed by the number of the list. For example, 2ndsecond and 1one gives L1L1.
To store the regression equation for graphing, in the Store RegEQStore RegEQ field, press VARSvars, select Y-VarsY minus Vars from the top menu, scroll down to Function...Function horizontal ellipsis, and press ENTEREnter key. Choose a y-variable from the list and press ENTEREnter key.
Highlight CalculateCalculate.
-
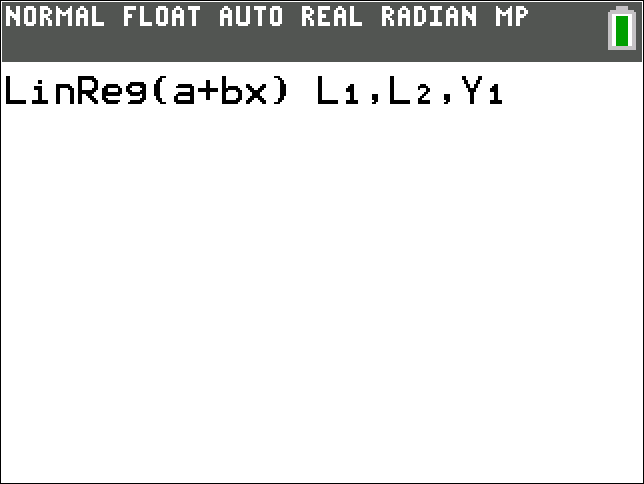
If not prompted, type L1L1, a comma, L2L2, a comma, and Y1Y1.
Note that lists can be entered by pressing 2ndsecond followed by the number of the list. For example, 2ndsecond and 1one gives L1L1.
Also note, to enter Y1Y1, press VARSvars, select Y-VarsY minus Vars from the top menu, scroll down to Function...Function horizontal ellipse, and press ENTEREnter key. Choose a y-variable from the list and press ENTEREnter key.
-
-
Press ENTEREnter key. The linear regression equation may also be viewed by pressing Y=Y equals.
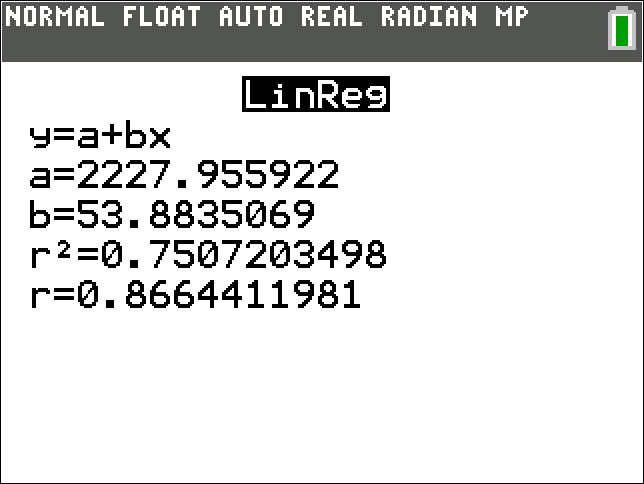
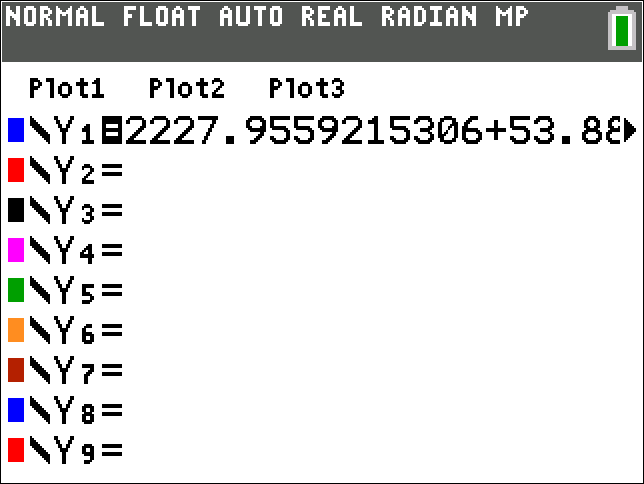
Note: If Diagnostics are OFF, only the equation and values of a and b will be displayed. See Correlation Coefficient and Coefficient of Determination for instructions to turn Diagnostics ON.
Calculating the P-value
-
After finding and storing the regression line, press STATSTAT, select TESTSTESTS from the top menu, and scroll down to LinRegTTestLinRegTTest. Press ENTEREnter key.
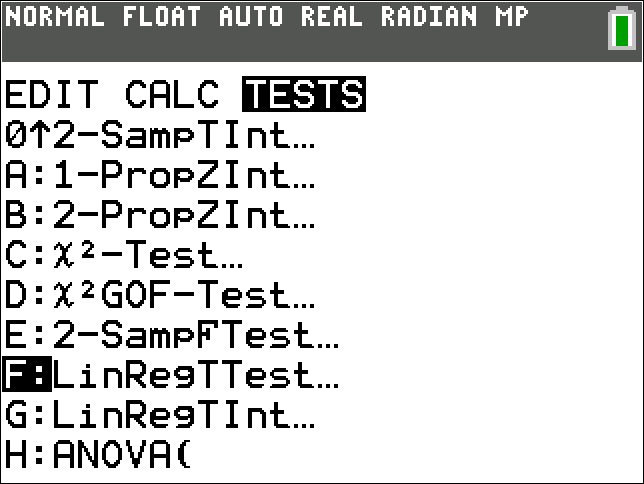
-
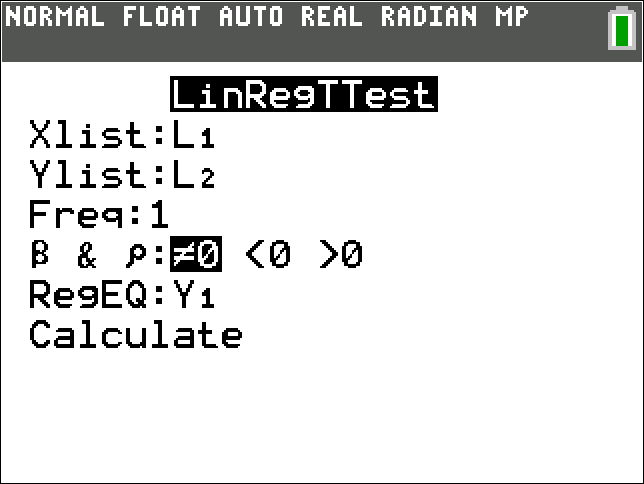
Verify XlistX list is L1L1, YlistY list is L2L2, and FreqFreq is 1one. Note that lists can be entered by pressing 2ndsecond followed by the number of the list. For example, 2ndsecond and 1one gives L1L1.
Verify ≠0not equal to zero is selected for β & pless than var greater than beta less than divided by var greater than ampersand less than var greater than p less than divided by var greater than .
For RegEQ Reg EQ, enter Y1Y1 by pressing VARSvars, selecting Y-VarsY minus Vars from the top menu, scrolling down to Function...Function horizontal ellipsis, and pressing ENTEREnter key. Choose Y1Y1 from the list and press ENTEREnter key.
Highlight CalculateCalculate.
-
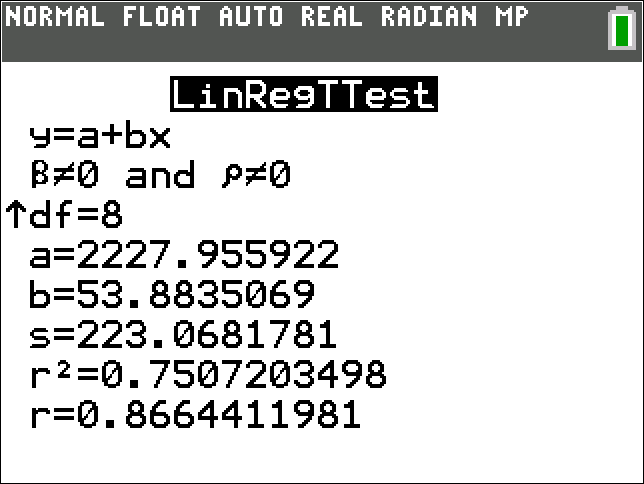
Press ENTEREnter key.
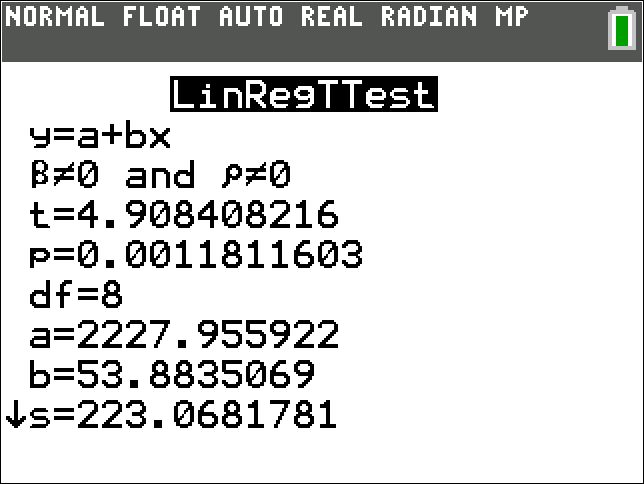
Standard Error of Estimate
-
press STATSTAT, select EditEdit from the top menu, choose Edit...Edit horizontal ellipsis, and press ENTEREnter key. See Adding Info to Lists for further help on entering your data.
-
Enter the x-values into L1L1 (pressing ENTEREnter key after each value), and the y-values into L2L2.
-
Press STATSTAT, select TESTSTESTS from the top menu, and scroll down to LinRegTTestLinRegTTest. Press ENTEREnter key.
-
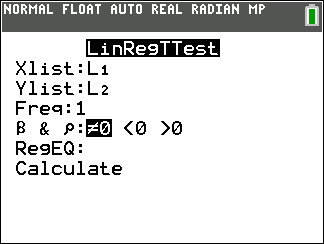
Verify XlistX list is L1L1, YlistY list is L2L2, and FreqFreq is 1one. Note that lists can be entered by pressing 2ndsecond followed by the number of the list. For example, 2ndsecond and 1one gives L1L1.
Verify ≠0not equal to zero is selected for β & pless than var greater than beta less than divided by var greater than ampersand less than var greater than p less than divided by var greater than.
Enter the regression equation into RegEQ Reg EQ if you have already calculated it. If not, you may leave this blank. To enter Y1Y1, press VARSvars, select Y-VarsY minus Vars from the top menu, scroll down to Function...Function horizontal ellipsis, and press ENTEREnter key. Choose Y1Y1 from the list and press ENTEREnter key.
Highlight CalculateCalculate.
-
Press ENTEREnter key. The standard error of estimate is ss.
Sampling
Random Samples
Random Integer Samples
-
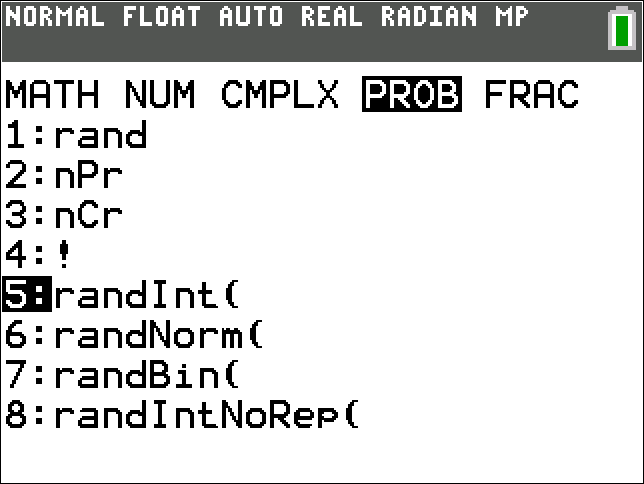
Press MATHMath, select PROBPROB from the top menu, and scroll down to randInt(randInt left parenthesis. Press ENTEREnter key.
-
-
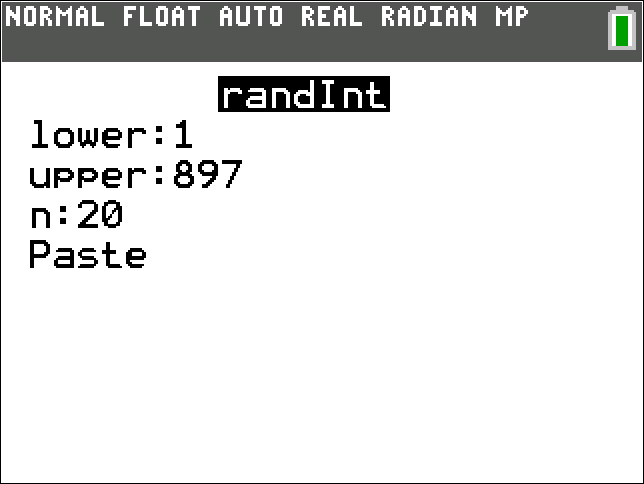
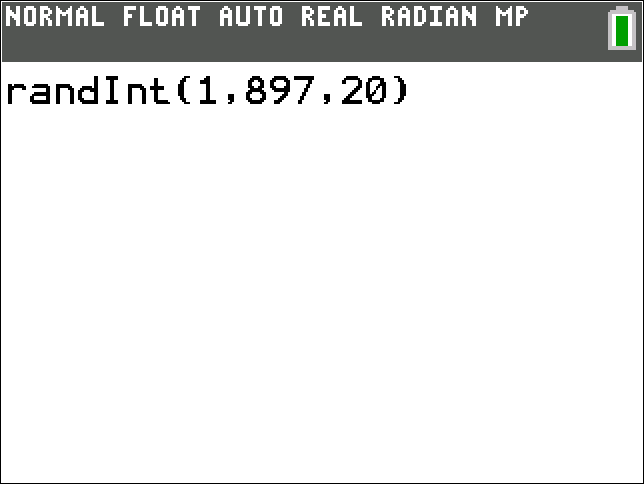
If prompted, input an integer lower bound of desired sample values, an integer upper bound of desired sample values, and the desired sample size.
Highlight PASTEPASTE and press ENTEREnter key.
-
If not prompted, type an integer lower bound of desired sample values, an integer upper bound of desired sample values, and the desired sample size, separated by commas.
-
-
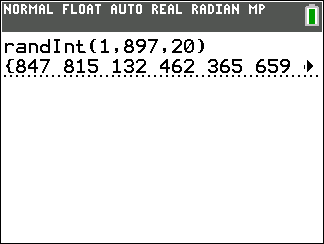
Press ENTEREnter key. The random integers are listed on the screen.
-
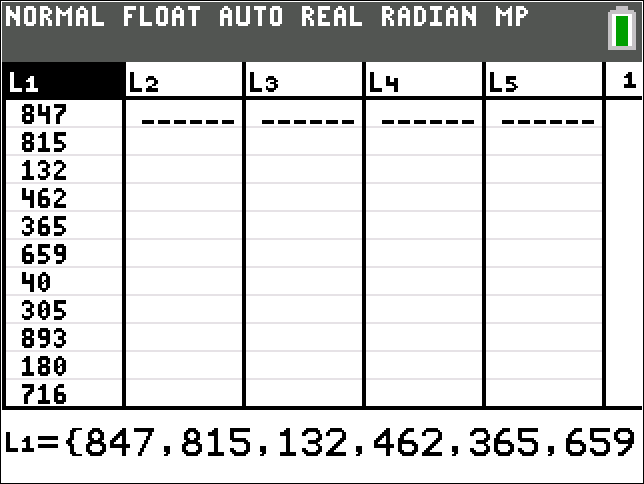
To store the sample in L1L1, press STO→STO→ semicolon, then 2ndsecond, and then 1one. Press ENTEREnter key.
Random Real Number Samples
-
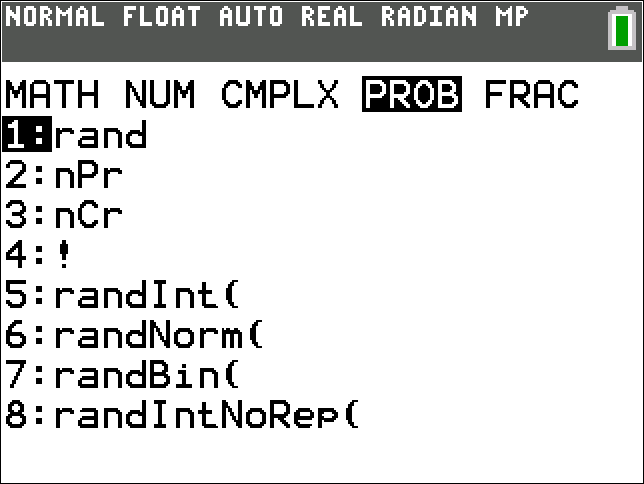
Press MATHMath, select PROBPROB from the top menu, and scroll down to randrand. Press ENTEREnter key.
-
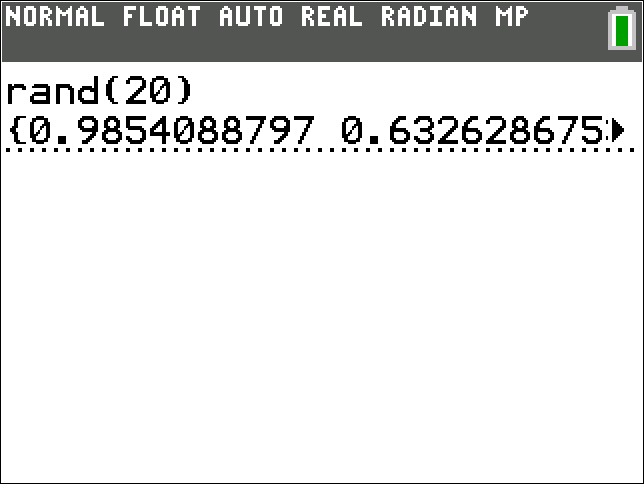
Type (left parenthesis, the desired sample size, and )right parenthesis. Press ENTEREnter key.
-
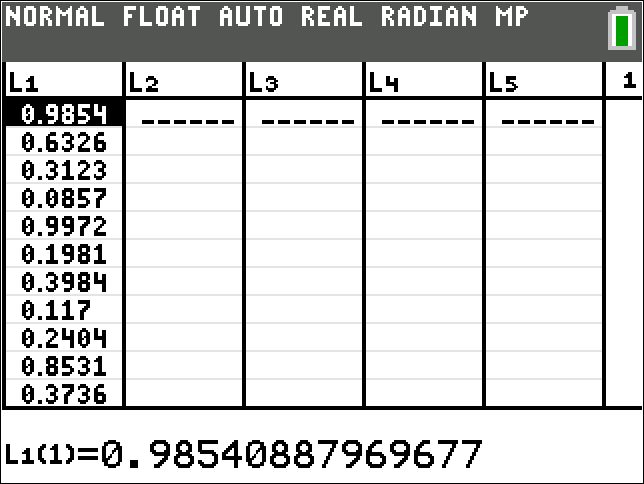
To store the sample in L1L1, press STO→STO→ semicolon, then 2ndsecond, and then 1one. Press ENTEREnter key.
-
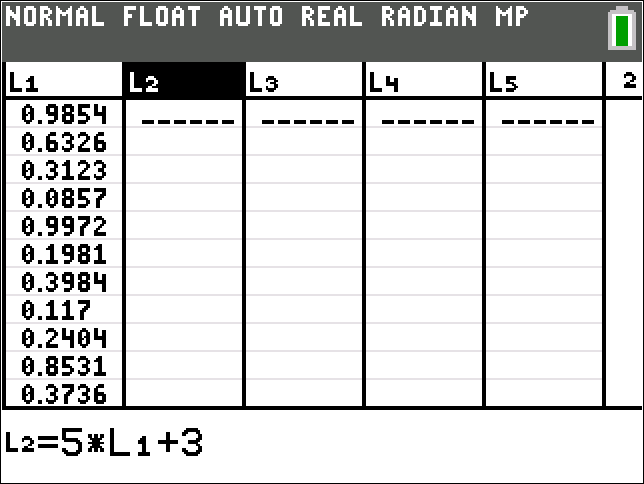
To adjust the range of the values in your sample, you will need to create a formula of the form a*L1+ba asterisk times L1 plus b, where bb is the minimum value of your desired sample and aa is the range of your desired sample. The value of aa can be computed by subtracting the minimum value of your desired sample from the maximum value of your desired sample.
-
press STATSTAT, select EditEdit from the top menu, choose Edit...Edit horizontal ellipsis, and press ENTEREnter key.
-
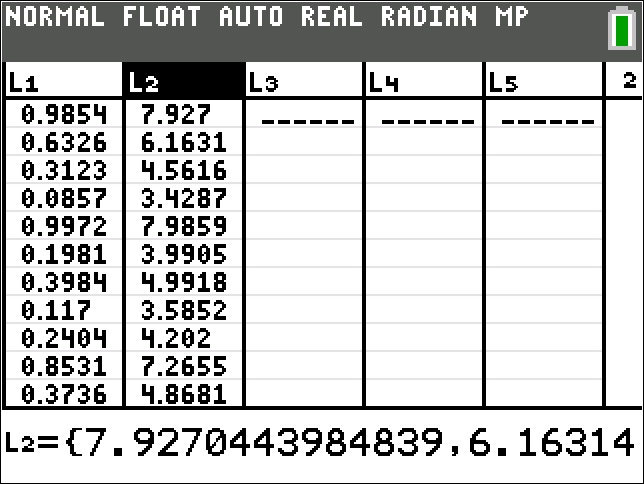
Highlight L2L2, enter the formula a*L1+ba asterisk times L1 plus b, and press ENTEREnter key.
Note that lists can be entered by pressing 2ndsecond followed by the number of the list. For example, 2ndsecond and 1one gives L1L1.
-
t-Distribution
Inverse t
-
Select DISTRDISTR by pressing 2nd2 less than sup greater than nd less than divided by sup greater than and then VARSvars.
-
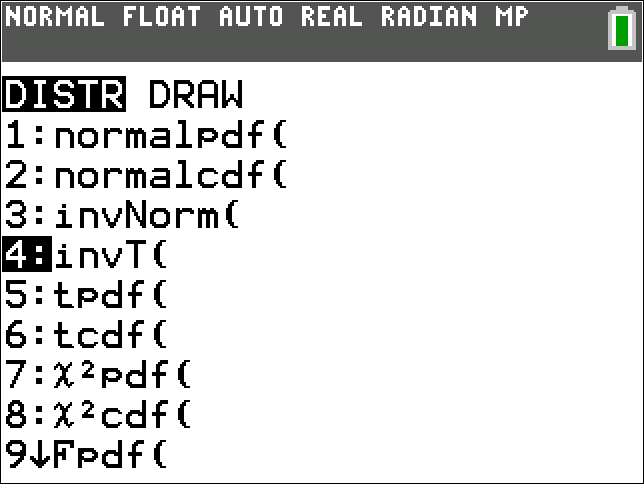
Scroll down to invT(invT left parenthesis. Press ENTEREnter key.
-
-
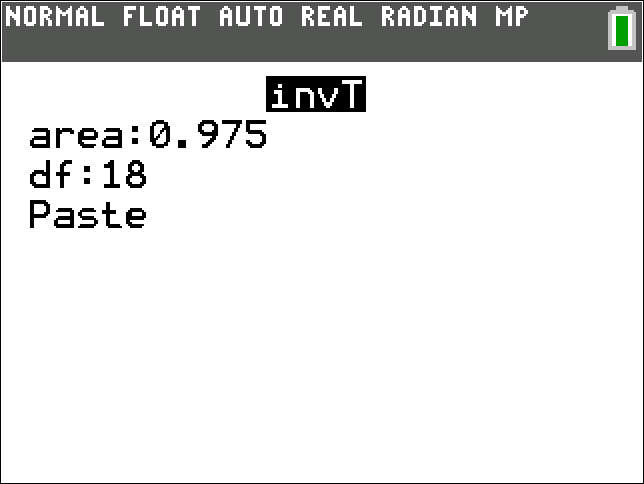
If prompted, input the area of the left tail and the degrees of freedom. Highlight PASTEPASTE and press ENTEREnter key.
-
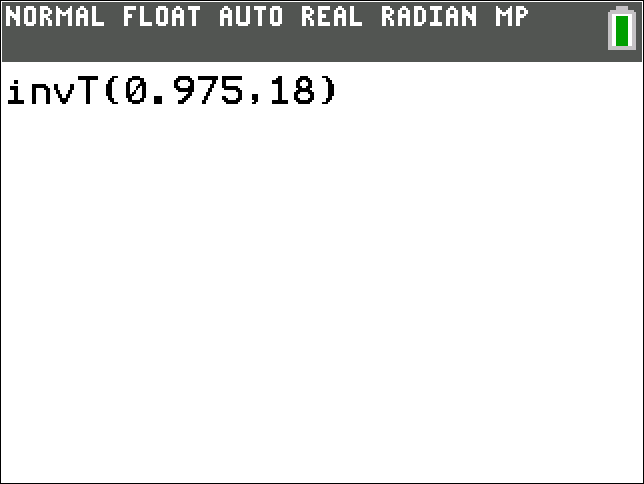
If not prompted, type the area of the left tail and the degrees of freedom separated by a comma.
-
-
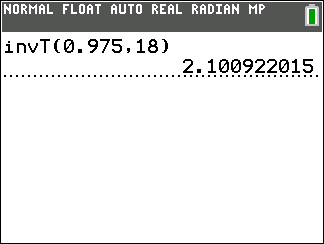
Press ENTEREnter key.
t-Probability (cdf)
-
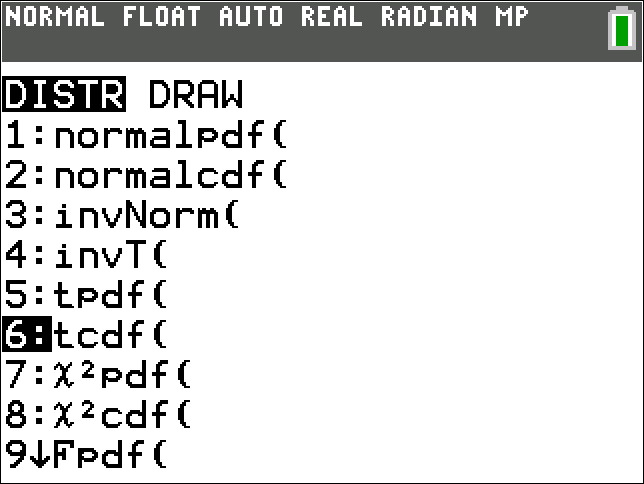
Select DISTRDISTR by pressing 2nd2 less than sup greater than nd less than divided by sup greater than and then VARSvars.
-
Scroll down to tcdf(tcdf left parenthesis. Press ENTEREnter key.
-
-
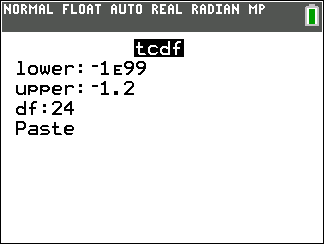
If prompted, input the lower t value, the upper t value, and the degrees of freedom. Highlight PASTEPASTE and press ENTEREnter key.
Note, if your lower bound is negative infinity or your upper bound is positive infinity, use a very large negative or positive number such as -1E99negative 1E99 or 1E991E99. The symbol EE is entered by pressing 2ndsecond and then ,,.
-
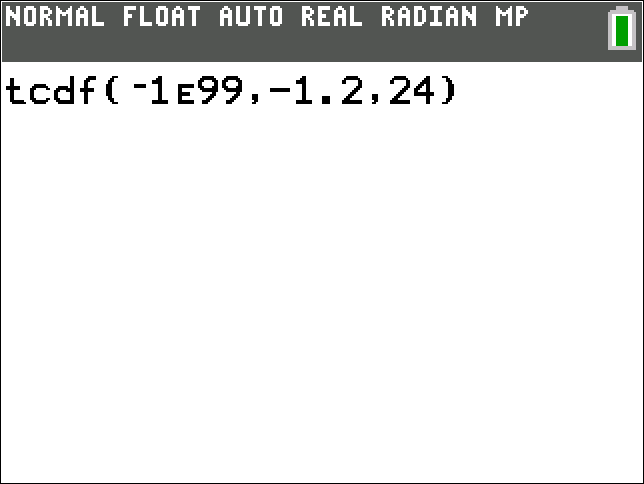
If not prompted, type the lower t value, the upper t value, and the degrees of freedom separated by commas.
Note, if your lower bound is negative infinity or your upper bound is positive infinity, use a very large negative or positive number such as -1E99negative 1E99 or 1E991E99. The symbol EE is entered by pressing 2ndsecond and then ,,.
-
-
Press ENTEREnter key.